
This post may contain paid links to my personal recommendations that help to support the site!
With Tableau being such a popular data visualization tool and being a much sought-after skill at the workplace, you’re probably considering if it’s the right choice for you. Some of you might even ask, who is Tableau designed for? Am I someone who might benefit from purchasing and using Tableau? Should I learn Tableau? Well, let me give you the most direct and shortened answer to your burning question.
Who is Tableau Designed For?
Tableau is designed for individuals without coding backgrounds who intend to present their data through data visualizations to improve processes in business intelligence. With the charting and dashboard functions available in Tableau, meaningful messages can be shared with stakeholders easily.
Now that you’ve been briefly introduced to who Tableau is designed for, you must be having some additional questions appearing in your head. Does this mean that only those for who Tableau is designed should be learning? Well, that’s not exactly the case here! Although Tableau is designed as a form of no-code analytics data visualization software, there are still a bunch of other great features that allow for a wider variety of users to benefit from the software.
Tableau is a visual analytics platform transforming the way we use data to solve problems—empowering people and organizations to make the most of their data.
TABLEAU SOFTWARE
In fact, I would even say that Tableau is able to cater to a range of analytics users, from everyday people to advanced analytics experts. Ultimately, we all have one goal, which is to present our data in a digestible manner! If you’re curious to find out more about the few main categories of people that Tableau is designed for, then do read till the end for the full picture to see if you fit in!
BONUS: I’ll be giving my personal experience of learning Tableau and you’ll also read about my honest opinion of whether you should learn it right at the end of this article!
What Type of Users is Tableau Designed For?

| Type of User | Purpose | Type of Analysis | |
| 1. | Users Without Coding Background | To produce a quick analysis of data without knowledge of technical programming. | Descriptive Analysis (Exploratory Data Analysis) |
| 2. | Advanced Analytics Users | To dig deeper into data and explore further insights. | Diagnostic Analysis, Predictive Analysis |
| 3. | Subject Matter Experts | To explore data relevant to the subject matter, for operational optimizations. | Descriptive Analysis () |
There are 3 main categories of users that I would forsee using Tableau. These categories were put together using some of my personal opinion as well as the current features designed on Tableau. For each type of user, I would be giving an overview of the persona of the user type as well as provide you with some actual features in Tableau that were designed for these users.
Everything we do is driven by our mission to help people see and understand data, which is why our products are designed to put the user first—whether they’re an analyst, data scientist, student, teacher, executive, or business user.
Tableau
Based on this quote I found on the Tableau website, I am quite confident that you would be convinced slightly that it might actually be designed for almost everyone! With analytics and data visualizations growing in importance, there’s no doubt that Tableau might be moving in that direction, right? Or are they? Let’s analyze some of the main types of users of Tableau as well as the likely features that they will be using respectively.
Type 1: Users Without Coding Background
This group of users might just be the largest group of all, simply because of how many people might fall into this category. The first user type is individuals without any sort of coding or programming background. Tableau is designed as a no-code analytics tool that allows you to build visualizations without having any form of knowledge of programming.
I would say that this user type is quite an obvious one, simply because the Tableau software streamlines and simplifies querying data and visualizing data to a high-level approach. Let’s have a look at some of the features designed in Tableau that these user types might use.
Features in Tableau That Might be Used:
- The Click-based Data Modelling and Joining feature
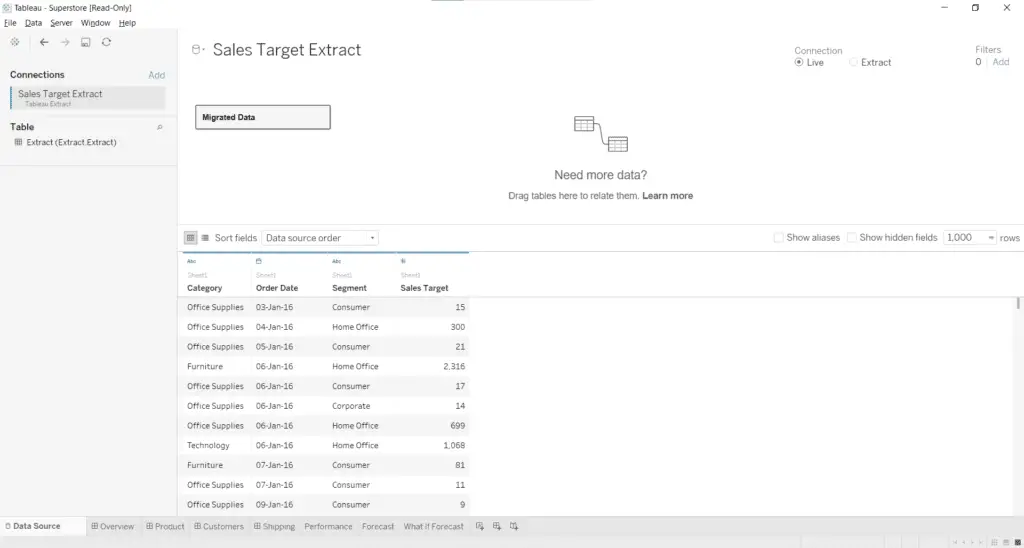
If you’ve ever tried loading data into Tableau using the default pre-loaded Superstore dataset, you’ll realize that there are data modelling options in the Data Source pane. This feature is a pretty useful one, especially for those without any coding background. In this pane, you’re able to create unions and joins of tables of data for further analysis.
I personally found this feature to be super useful because it completely removes the need for any knowledge of Structure Query Language (SQL) when doing simple queries of data. This lowers the barrier for entry to users with no coding background. In my opinion, this can attract many new users to the Tableau platform, because of its ease of use.
- The “Show Me” feature
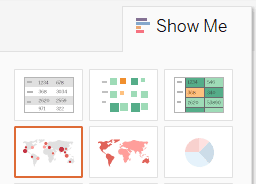
Another neat feature that’s beneficial for non-coding users is the “Show Me” button. This button is the single reason why data visualizations are made quickly and efficiently by non-coding users. This button converts one chart types from one to another with just a few clicks of a button. Of course, this would depend on the type of data that you’ve provided to Tableau.
In my personal experience of using this feature, I’ve been able to produce graphs at a fast pace when an immediate analysis is needed. I would be able to create a bar chart from a line chart and convert that immediately into a heat map with just a few clicks! Coming from a background of learning R for data visualizations, this convenience really blew me away.
What would have taken me a good 30 minutes to an hour of fiddling with parameters and arguments in ggplot2 in R was solved in a few clicks.
AUSTIN
Do I still even have to learn programming to present my data anymore?
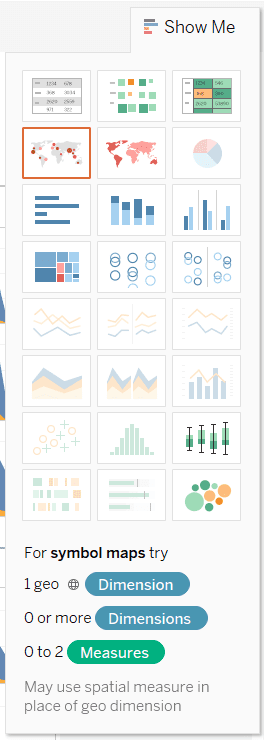
Here’s a screenshot of the full drop-down pane of all the possible visualizations a user can create using the “Show Me” feature. How convenient, right?
Type 2: Advanced Analytics Users
The next user type of advanced analytics users is the experts that are well-versed in data analytics just like some of you guys! These users are proficient in programming and data visualizations and are usually found pushing the limits of the functions available in Tableau to provide a more intuitive analysis of their data.
Features in Tableau That Might be Used:
- Analytics Pane
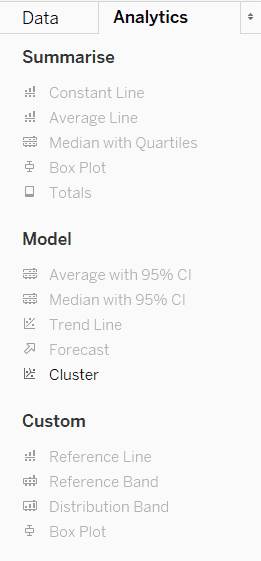
Tableau has a specific Analytics Pane that features a selection of statistical analysis tools for advanced analysts to choose from. These include some that I’ve found to be quite useful for statistical analysis: for example, the Average Line and the Reference Band. This can be useful for looking at historical data. These features must have been designed specifically for advanced users to do more with their data.
- Calculated Fields
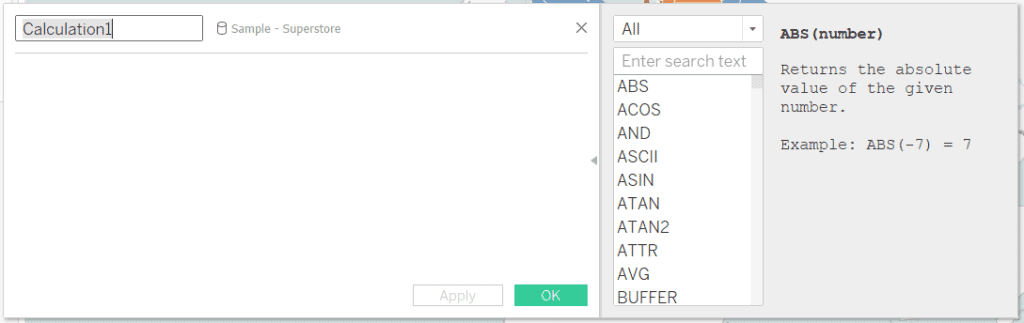
Calculated fields in Tableau are the equivalent of formulas in Microsoft Excel. They provide flexibility and additional functionality to the current in-built features in Tableau. These were likely to be designed for the purpose of providing extra features for advanced users to play around with to take their analysis to the next level, as well as to create workarounds to some issues found in Tableau.
Type 3: Subject Matter Experts
The last user type would be subject matter experts that use Tableau on a regular basis. These individuals do not deal with analysis directly and are usually using Tableau for viewing and data exploration purposes only.
For example, a dashboard could be shared by a data analyst for the purpose of creating some type of actionable analysis. In this case, the subject matter expert users would be opening up a Tableau dashboard to explore the available charts to filter out the necessary data for relevant insights. These users are usually cross-departmental and are working closely with a data analyst using a Tableau Viewer license. This means that they would not be using any features involving editing charts but playing only with the end data visualization to dig for insights.
Features in Tableau That Might be Used:
- The Dashboard feature
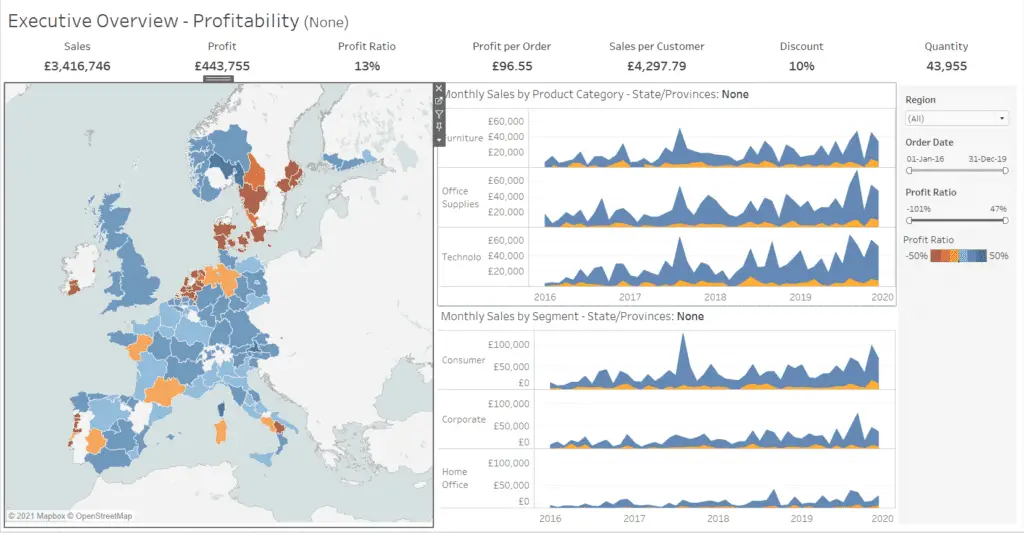
Tableau allows one to put together several charts called “Views” to produce an easily digestible and interactive dashboard. This dashboard is designed perfectly for subject matter experts because of their intuitiveness and ease of use.
- The “Use view as Filter” function
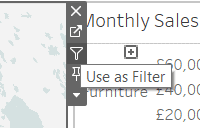
The “Use as Filter” function in Tableau allows one to sieve through data and reflect them on all visualizations on a dashboard. For example, if a specific section of a chart is chosen when this feature is turned on, all other charts within a dashboard would be filtered to only contain the data chosen. This neat feature was designed for ease of analysis as well as a good way to identify any underlying causes of a problem.
Who Will Benefit from Purchasing and Using Tableau?
Here’s another big question that comes up after understanding who exactly is Tableau designed for. Who would benefit the most from making that purchase of Tableau software and eventually using it?
The short answer is: Users without any coding background would stand to gain the most from getting Tableau for their analysis. Tableau provides a great alternative to programming for the production of data visualizations through no-code analytics. This is potentially beneficial to such users for time-saving as well as a simplified process for data visualizations.
Should You Learn Tableau?

One should learn Tableau regardless of knowledge level because of the simplified no-code analytics functions available. Tableau also offers many advanced and complex statistical functions for advanced users. With a design that offers something for both new and expert analytics professionals, everyone should learn Tableau.
Moreover, according to this article by Forbes, there is a growing demand for Tableau of 1,581%. This is a strong sign that one should be comfortable with Tableau, regardless of whether you’re a subject matter expert who is an end-user, an analyst or even a student.
You can start with a simple book to help you get started with all of the design elements of building a dashboard in Tableau. Here’s an article I wrote about the Big Book of Dashboards.
Alternatively, you can get started with more guidance through an online course. Having a well-structured plan can really help you get the foundations right, at the right pace. You can start with this course from Coursera: Data Visualization with Tableau.
Need a simple list of clever ways to learn Tableau? Check out this other post I wrote about that over here.
My Personal Experience

I would like to end this article with a quick personal opinion of the Tableau data visualization tool and who it is designed for. Firstly, if you’ve been reading this article to figure out if you fit into the few user groups I’ve mentioned to decide if learning Tableau is for you, then I’ve got to say that you wouldn’t want to miss out on learning Tableau. If you’ve not already realized, almost everyone would fall under the 3 user types I’ve mentioned. This is simply because the design of Tableau is pretty inviting for all users.
I’ve personally been part of the non-coding background individuals as well as the advanced analyst user type. Based on my opinion, my experience working with Tableau has been quite a blast, such that I have not been touching on my Python and R programming languages for creating charts for a while now (although I should really start them again)!
If you’re on the fence about deciding if learning and stepping into the world of Tableau data visualizations is for you, I strongly urge you to just give it a try! Here’s a quick link to a trial on their website for you to get started: Tableau
Final Thoughts
Tableau is a great software for data visualizations that have probably been designed over the years to fit into all 3 of the user types I’ve mentioned: users with no coding background, advanced analytics users and subject matter experts. This means that you would most definitely not be disappointed with trying out Tableau for all your charting and dashboarding work. Hope this has been informative for you, thanks for reading!
My Favorite Learning Resources:
My Recommended Learning Platforms!
| Learning Platform | What’s Good About the Platform? | |
|---|---|---|
| 1 | Coursera | Certificates are offered by popular learning institutes and companies like Google & IBM |
| 2 | DataCamp | Comes with an integrated coding platform, great for beginners! |
| 3 | Pluralsight | Strong focus on data skills, taught by industry experts |
| 4 | Stratascratch | Learn faster by doing real interview coding practices for data science |
| 5 | Udacity | High-quality, comprehensive courses |
My Recommended Online Courses + Books!
| Topic | Online Courses | Books | |
|---|---|---|---|
| 1 | Data Analytics | Google Data Analytics Professional Certificate | – |
| 2 | Data Science | IBM Data Science Professional Certificate | – |
| 3 | Excel | Excel Skills for Business Specialization | – |
| 4 | Python | Python for Everybody Specialization | Python for Data Analysis |
| 5 | SQL | Introduction to SQL | SQL: The Ultimate Beginners Guide: Learn SQL Today |
| 6 | Tableau | Data Visualization with Tableau | Practical Tableau |
| 7 | Power BI | Getting Started with Power BI Desktop | Beginning Microsoft Power BI |
| 8 | R Programming | Data Science: Foundations using R Specialization | Learning R |
| 9 | Data Visualization | – | Big Book of Dashboards |