
This post may contain paid links to my personal recommendations that help to support the site!
Chances are, you’ve been looking around for the best reference books out there for your real-world dashboard needs and you’ve finally come across The Big Book of Dashboards as your dashboard reference book. If that is you, fret not! I’ve been in the exact same situation as you and I had to do quite a huge amount of research before my purchase to make sure it was worth it.
The Big Book of Dashboards is an applications-focused reference guide for data visualizations across a wide variety of real-world business problems. This book is perfect for data analysts, business intelligence analysts, or any business professional as a dashboard reference resource and a source of inspiration.
There aren’t any definitive reviews available out there that provide a users’ perspective and a comprehensive overview. and I figured that I should put together this full review of the Big Book of Dashboards to help people like you make a better decision before your purchase. Read on below for a summary and overall table of the book, a detailed content review as well as my personal user’s input on this book!
| Part | Summary | My Thoughts |
| 1. A Strong Foundation | Data Visualization Foundations Good overall foundation of basic statistics and data visualizations to present them. | I enjoyed the quick recap of statistics and dashboard basics before diving into the scenarios. |
| 2. The Scenarios | Scenario-based Dashboard Applications Detailed breakdowns of each chart in each dashboard along with their associated questions that these charts answer. | The in-depth analysis of each dashboard was refreshing to have, especially when the authors gave their commentary on how each dashboard did well or provide additional advice. |
| 3. Succeeding in The Real World | Dashboard Best Practices and Pitfalls A brief overview of some common problems beginners face and how to best tackle them. | I really enjoyed the sections that explain some common beginner mistakes and pitfalls together with recommendations of their own. |
| Conclusion | An excellent book for real-world applications of dashboards that both beginners and advanced users can learn from and apply to their business needs. |
Is This Book Worth Buying?
The Big Book of Dashboards is worth buying for its value at such a price point of USD$50. It is perfect for data professionals who are looking for a quick reference guide for scenario-specific dashboard examples. Written for data visualization developers like data analysts, this book provides numerous dashboard examples based on possible applications across departments and functions that data analysts typically face.
Background of This Book
Before we dive right into the review of the content of this book, I figured that I would put together some background information about this book and some quick facts that may come in helpful for those among you who may be looking at purchasing this book for the first time.
Let’s get started!
Quick Facts About This Book
Here’s some facts I gathered when doing basic research about the book on online shops like Amazon. This table should help summarize all that information.
| Facts | Detail |
| Cover |  |
| Authors | Steve Wexler, Jeffrey Shaffer and Andy Cotgreave |
| Book Dimensions | 8.81 x 1.02 x 8.66 inches (Square-shaped) |
| Publication Date | April 24 2017 |
| Pages | 448 (432 indexed) |
| Cover Type | Paperback and Kindle |
| Cost | USD $50 to $60 |
| Where to Buy | Amazon, Book Depository, Wiley |
Background of the Book Authors
Being the curious person that I am, I went to do a background search of the 3 authors who contributed to writing the Big Book of Dashboards. Naturally, you’d want to be learning from someone who knows their craft really well, right? Lucky for you, I’ve already did some preliminary research on the authors and put them into an easy table for your reference.
| Author Name | Steve Wexler | Jeffrey Shaffer | Andy Cotgreave |
| Background | – Founder of Data Revelations a data visualization consultancy. – An expert in the data visualizations field as a Tableau Zen Master, Iron Viz Champion and Tableau Training Partner. | – Chief Operating Officer and Vice President of Information Technology and Analytics at Unifund and Recovery Decision Science. – An adjunct professor at the University of Cincinnati in the Carl H. Lindner College of Business teaching Data Visualization. – A five-time Tableau Zen Master -Regular Data Visualization and Tableau Blogger at DataPlusScience.com | – Technical Evangelist for Tableau Software – More than 15 years of experience in data visualization and business intelligence |
| Website | Data Revelations | DataPlusScience | GravyAnecdote |
| Other Books Written | The Big Picture | – | – |
| Twitter Profile | |||
| LinkedIn Profile | |||
| Tableau Public Profile | Tableau Public | Tableau Public | Tableau Public |
You would have probably already realized that the authors sound really credible and they seem to know their stuff about data visualizations. All 3 of them have published blogs relating to data visualizations as well as upload their dashboards on an online platform like Tableau Public. Based on the search I’ve done, the dashboards I found of them were really impressive and inspiring. I would say that I’m pretty convinced of their visualization knowledge based on their online portfolios.
In fact, some of the dashboards published by them have been featured in this book! I’ll to more on later, let’s move on to the content of this book.
Content
The Big Book of Dashboards is generally split into 3 main content pillars that provide a good balance of information from introductions and foundations to tips and tricks like best practices.
3 Main Content Pillars of this Book
- A Strong Foundation (Data Visualization Foundations)
- The Scenarios (Scenario-based Dashboard Applications)
- Succeeding in the Real World (Dashboard Best Practices and Pitfalls)
1. A Strong Foundation (Data Visualization Foundations)

“We visualize data to harness the incredible power of our visual system to spot relationships and trends.”
The Big Book of Dashboards, Chapter 1, Data Visualization: A Primer
About This Section
This book begins with the first few chapters consisting of a brief introduction to world of data visualization and the common charts available. You’ll be introduced to the different statistical analysis methods and their respective charts. You’ll also be introduced to the idea of dashboards and their functions.
My Thoughts on This Section
- A good coverage of basic statistics and charts
- A good introduction of how to highlight areas of interest using charts
- A good introduction to the basic elements of a dashboard
- Lack of introduction to the different basic visualization tools available
Cat Icon to Indicate Bad Examples
This book made clever use of a cat icon to indicate all the bad graphs so readers like and you and I can pick out only the good graphs and dashboards to take as an example. This was REALLY useful when I used this book for a quick reference guide because I did not have the time to read the text around the images. In such a situation, I would only be looking for the easiest and first few relevant graphs I could find. With the help of the cat icon, I could easily sieve out only the useful graphs to take reference from!
Here’s an article I found explaining more about the cats, written by one of the authors, Steve. Enjoy!
Although this section was rather short for a foundation in data visualization, this section was only intended to serve as a primer to those who have less experience in creating dashboards. However, I felt that it was sufficient for any beginner to pick up this book and still learn something.
2. The Scenarios (Scenario-based Dashboard Applications)

About This Section
Here’s where I found the most value in this book. In this section, the authors give dashboard reviews and in-depth explanations of the components of each dashboard. You’ll be given dozens of scenarios based on real-world business problems solved through dashboards! Let me show you some of the dashboards that were reviewed as well as the links to the respective online dashboards.
Dashboard Example 1
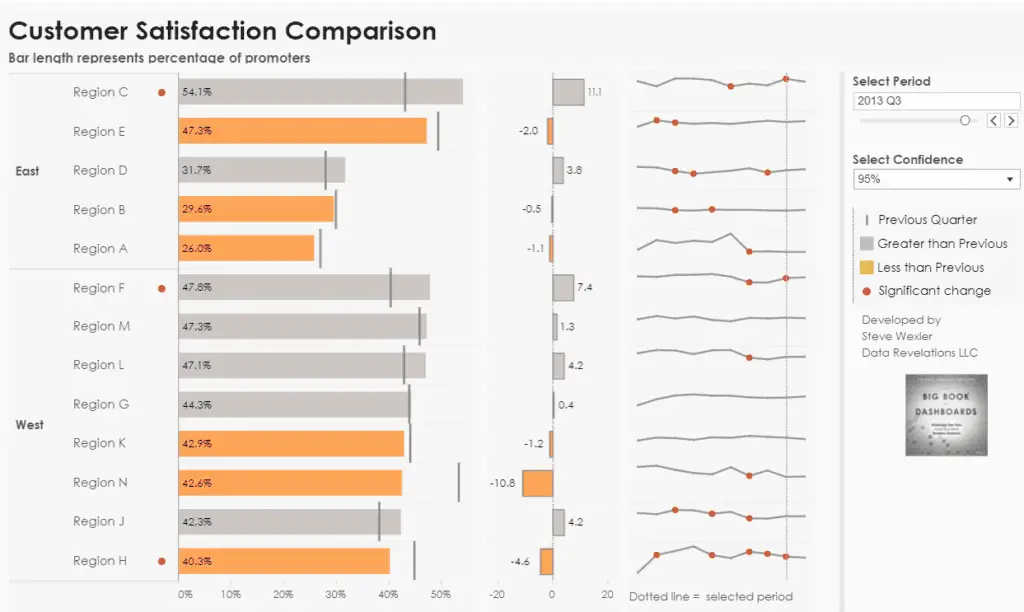
This dashboard compares the ranking by now and comparing with then, for customer satisfaction. This dashboard was made by one of the authors, Steve Wexler. In the explanations provided in this chapter, the authors elaborate on all the different charts used and why they work to solve the business problem. This dashboard was made using Tableau data visualization software and was published by Steve on his Tableau Public profile. You can check it out for yourself (here).
Dashboard Example 2
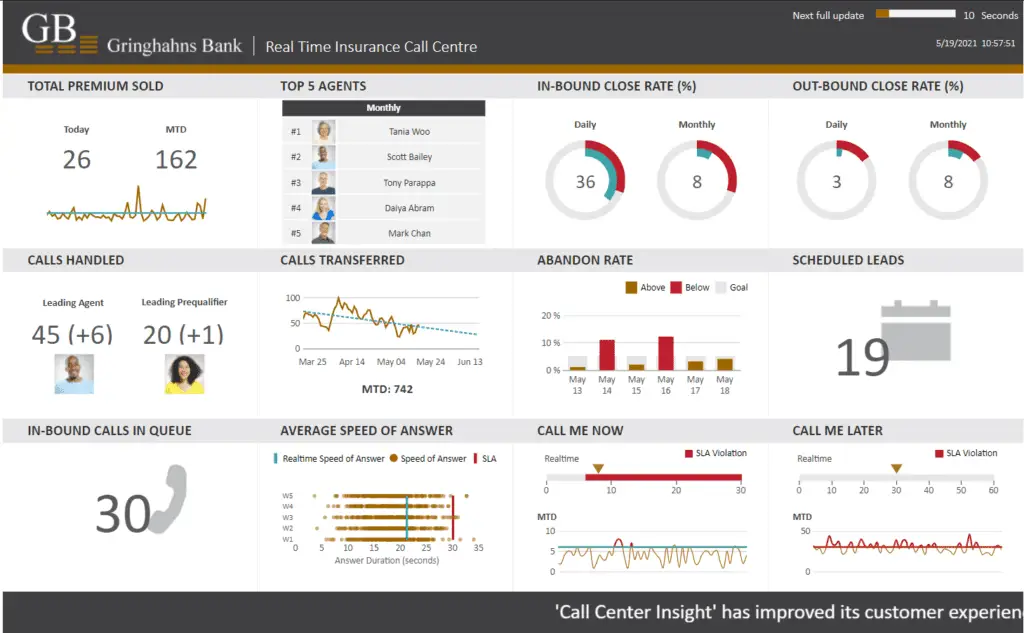
This dashboard tracks the calls of a call center and was designed by Jeff Hainsworth for Dundas Data Visualization. The charts were put together using the Dundas BI data visualization tool. This is an example of a dashboard review made by the authors on an external dashboard. This gave me a different perspective and alternative approaches to the dashboard for call centers. You can check out this live dashboard at his link (here)
My Thoughts on This Section
This section was just what I needed in my early journey of learning data visualizations and designing dashboards. There were detailed breakdowns of each chart in each dashboard along with the associated questions that these charts answer. What a great thing to have something explain the reasons behind their decision of the charts chosen!
Moreover, I found that, for the most part, there was easy readability, as there were many visual aids and charts. There’s no one page with only just text! If you’re a visual learner like myself, I’m sure you’re in for a visual treat. I mean, who doesn’t expect to see lots of charts in a data visualization book, right? The charts are also put into comparisons with traditional visualization to determine how suitable a chart is.
The selection of featured dashboards was great too. Dashboards chosen are a variety of either their own creations (which they give more detailed explanations about) or dashboards made from other well-known tableau masters like Ryan Sleeper (which they give reviews and opinions of).
In each dashboard review, the authors also go through a handful of possibly related scenarios that provide good alternative uses to the dashboard given. Thinking from the perspective of a user, the authors explain how it might be used by the user like the interactions they make.
Another feature I love is the Author’s Commentary segment of each chapter, where the authors give their personal opinions in a casual tone with very practical advice. It feels like there’s a group of data visualization professionals having a discussion on the areas to improve for the dashboard, where they provide input for areas for improvement like user readability. Another example would be how they recommended not having any interactivity of dashboards when optimizing for mobile viewing, which made really good sense to me!
3. Succeeding in the Real World (Dashboard Best Practices and Pitfalls)

About This Section
This final section of the book covers a range of topics within data visualization that are crucial in helping you improve your dashboard to the next level and succeeding in the real world! From topics ranging from understanding the user to learning ways to present certain data like time data, this section is an information-packed one that is perfect for solidifying your learning.
My Thoughts on This Section
The best advice usually comes from those who have been through their mistakes. That’s why this section is just so crucial in helping you make the best dashboards. I really enjoyed the sections that explain some common beginner mistakes and pitfalls. Of course, the authors provide alternatives to these mistakes with some recommendations of their own.
After reading these few chapters, I realized how much I’ve been doing things wrong and all the beginner mistakes are scarily accurate! This is why I would recommend this book to any data visualization or dashboard enthusiast looking for some guidance. If only I had this book at the start when I first started making my first few dashboards!
My Overall Thoughts

This book has generally taught me quite a substantial amount of skills and knowledge that will definitely go a long way in helping my work as a data analyst! However, although I may sound like I’ve thoroughly enjoyed all the content in this book, there are definitely some areas that I wished could be better. I’ve put together some of the main pointers together in a summary table for your reference below to help you make the decision for yourself too.
| What I Liked | What I Didn’t Like as Much |
| 1. Big and clear visual illustration screenshots of dashboards created | 1. No dashboard examples from excel and power bi, only limited to tableau dashboards |
| 2. Has good tips and explanations for unconventional charts not typically used | 2. Did not include how some of the charts could be made |
| 3. Useful purple boxes with hidden tricks and advice | 4. Some dashboards are outdated |
| 4. Applicable dashboard examples | 5. Dashboard examples used did not state the tool they used |
| 5. Useful cat icon to indicate bad graphs |
What I Particularly Liked About This Book
- Big and clear visual illustration screenshots of dashboards created
- Has good tips and explanations for unconventional charts not typically used
- This can provide some good best practice for beginners in creating dashboards or inspire advanced users to create visualizations with higher value and complexity.
- Useful purple boxes
- They provide tips and extra advice to go further in explaining some concepts
- Good variety of dashboard applications and types (reports, mobile dashboards and live dashboards)
- Applicable
- Good to have some practical advice and applications for common areas found in BI and data analytics
- Useful cat icon to indicate bad charts
What I Didn’t Like as Much About This Book
- No dashboard examples from Excel and Power BI
- Mostly Tableau and Dundas BI
- No instructions or chart tutorials
- Did not include how some of the charts could be made
- Some of the dashboards are outdated
- Dashboards have been changed over time (so these can’t be viewed and played with)
- No mention of which software was used
- All the dashboard examples used did not state the tool they used, which can be frustrating to not know how to replicate (I only knew where some came from because of my knowledge of tableau as well as some background research)
Summary

I recommend this book because of the high-value real-world business problem dashboards reviewed as well as the great data visualization advice that is great for both beginners and advanced data visualization developers.
Austin, anyinstructor.com
In summary, the Big Book of Dashboards is an applications-focused data visualizations guide that’s perfect if you’re looking for a wide variety of real-world business problems and cases. The content is engaging and enriching and is split into 3 sections: data visualization foundations, scenario-based dashboard applications, and reviews, and data visualization best practices and common pitfalls. With data visualization experts Steve Wexler, Jeffrey Shaffer, and Andy Cotgreave weighing in on the dashboards, you’re definitely going to be learning the right thing. This book is perfect for data analysts, business intelligence analysts, or any business professional as a dashboard reference resource and a source of inspiration.
Here’s a truthful statement I found in the book, just so that you can manage your expectations.
“You will not find any perfect dashboards in this book. In our opinion, there is no such thing as a perfect dashboard.”
The Big Book of Dashboards
Who Should Buy This Book?
You Should Buy This Book Only If:
- Your job demands a lot of dashboards (data analysts, BI analysts, business analysts)
- You require inspiration and quick reference examples
- You need business-focused real-world examples
Who Should Not Buy This Book?
You Should Not Buy This Book If:
- You are intending to use it for examples to present research-focused data only
- You are looking for instructional guides and not explanations
- You are looking for updated examples (dashboard from Chapter 19 has since been changed)
Where Can I Buy This Book?
If you’re still on the fence of purchasing this excellent book, I would recommend checking out this sample below of chapter 24 of the book to see if it’s for you!
Sample of Chapter 24 (Showing Churn or Turnover)
Still not convinced? Here’s a blog post by Andy Cotgreave, an author of this book, explaining more about data visualization tips, some of which were included in this book.
Final Thoughts
This has been a pretty hefty review and I had to do quite a good amount of research to make sure your money is well-spent and well-researched. I hope this review has been of help to you! If you’ve decided to finally get the book, you can use my Amazon link for your purchase. Thank you!
My Favorite Learning Resources:
My Recommended Learning Platforms!
| Learning Platform | What’s Good About the Platform? | |
|---|---|---|
| 1 | Coursera | Certificates are offered by popular learning institutes and companies like Google & IBM |
| 2 | DataCamp | Comes with an integrated coding platform, great for beginners! |
| 3 | Pluralsight | Strong focus on data skills, taught by industry experts |
| 4 | Stratascratch | Learn faster by doing real interview coding practices for data science |
| 5 | Udacity | High-quality, comprehensive courses |
My Recommended Online Courses + Books!
| Topic | Online Courses | Books | |
|---|---|---|---|
| 1 | Data Analytics | Google Data Analytics Professional Certificate | – |
| 2 | Data Science | IBM Data Science Professional Certificate | – |
| 3 | Excel | Excel Skills for Business Specialization | – |
| 4 | Python | Python for Everybody Specialization | Python for Data Analysis |
| 5 | SQL | Introduction to SQL | SQL: The Ultimate Beginners Guide: Learn SQL Today |
| 6 | Tableau | Data Visualization with Tableau | Practical Tableau |
| 7 | Power BI | Getting Started with Power BI Desktop | Beginning Microsoft Power BI |
| 8 | R Programming | Data Science: Foundations using R Specialization | Learning R |
| 9 | Data Visualization | – | Big Book of Dashboards |
More Articles For You
- 5 Ways to Start Learning Data Science
- How I Would Learn Data Analytics in 2024
- How to Learn Data Analytics in 2024
- AWS Cloud Technology Consultant Professional Certificate: Review
- Microsoft Power BI Data Analyst Professional Certificate: Reviewed!
- Tableau Business Intelligence Analyst Professional Certificate: A Review