This post may contain paid links to my personal recommendations that help to support the site!
Looking for some interesting Tableau project ideas to help you learn Tableau or become a data analyst? Whether you’re a beginner or an expert data visualization analyst, I’ve got you covered.
In this blog post, I’ll be sharing 11 fun and unique Tableau project ideas as inspiration. Do read on to find out what each of them is!
What are Some Tableau Project Ideas for Beginners & Experts?
Here are 11 projects ideas to get you started in Tableau, ranging from simple to complex.
1. Analyze Your Social Media Usage

If you’re a regular social media user, have you ever wondered how much time you spend on each platform? Tableau is the perfect tool to help you find out!
To get started, you can download your data from your social media account (e.g., Facebook, Twitter) onto your laptop/computer. Once you have that data, you can either clean that data using Python or in Tableau using SQL.
You’ll also want to do some exploratory data analysis using some of your other data tools.
Lastly, connect Tableau to the social media data and start analyzing away.
You can look at things like:
- How much time do you spend on each social media platform?
- How often do you check your social media accounts?
- What time of day are you most active on social media?
Tableau projects like these are also great to share with your friends and family because they’re fun in nature!
2. Recreate an Infographic in Tableau
This is a great Tableau project idea for beginners who want to learn how to use Tableau’s various visualization types with some guidance on design.
To get started, first, choose an infographic that you like. This can be from your favorite newsletter or website. Once you have that, try to recreate it in Tableau.
This will help you learn how to use Tableau’s various visualization types as well as get some experience with design.
This is one of the easiest Tableau projects that any beginner can take on. Since an infographic data visualization is static, you won’t need to worry about interactive elements.
Here’s a simple infographic I made quite a while back in Tableau on mental health:

View more on Tableau Public page.
If you’re new to Tableau, I’d recommend using the Tableau public software to create Tableau projects for free. It’s a good place to start, and it has all the features of a business intelligence tool.
3. Visualize Your Travels
Have you gone on any trips lately? Tableau is a great way to visualize your travels and create a beautiful travelogue. This project is for those with wanderlust!
To get started, simply gather all the photos and videos from your trip as well as any relevant data (e.g. cost of flights, accommodation, etc.). Once you have that, connect Tableau to the data and start creating your visualizations.
Create multiple dashboards and link them up together with navigation buttons! For example, insert photos of locations and link them to more detailed data of those specific locations.
You can look at things like:
- Your travel route
- How much you spent on your trip
- What activities you did do while on your trip
- Number of steps you’ve taken
Tableau projects like these are also pretty ways to summarize your travels while honing your visualization skills, especially if you’ve had a road trip or when hopping between neighboring countries.
4. Analyze Your Favorite Sports Team’s Stats
Are you a sports fan? Tableau is a great way to visualize your favorite sports team’s stats and performance over time.
To get started, gather data on your favorite sports team from the internet or from the team’s official website. Once you have that data, connect Tableau to it and start creating your visualizations.
To make it better, be sure to insert relevant images into your Tableau dashboard, such as sports player photos.
You can look at things like:
- The team’s win/loss record
- Player stats
- Team stats
- Opponent stats
If you’re keen to take your project one step further, you can even do predictive analysis on specific players.
Sports has a huge market and use case for data analytics, and having a tableau project on it can really showcase your Tableau skills to future employers!
5. Create a COVID-19 Disease Spread Dashboard
This Tableau project idea is for those who want to learn how to create a Tableau dashboard and also, do their part in helping track the spread of COVID-19.
Data sets for this project can be found on Johns Hopkins University’s GitHub repository, which contains up-to-date data on the number of confirmed cases, deaths, and recoveries for COVID-19.
Do take note to make use of government-verified data so that your sample data is accurate and others can use it too.
To get started, simply connect Tableau to the dataset and start creating your dashboard.
Be sure to analyze data that’s relevant, such as:
- The date
- Number of confirmed cases
- Deaths
- Recoveries
You can also add filters so that users can view the data for a specific country/region.
6. Track Your Local Area Real Estate Prices
If you’re thinking of buying a house or are just curious about the real estate market in your area, Tableau is a great way to track prices and analyze household price data.
To get started, you can find data sets on local area real estate prices from websites such as Zillow. Once you have that data, make sure it’s clean, connect Tableau Desktop to it and start creating your visualizations.
You can look at these values:
- The median home price
- The average home price
- Homes sold above/below the asking price
- Homes for sale by square footage
Through this data analysis, you’ll be more well-informed about the real estate prices in your area. This might even help you in valuing your house!
For advanced Tableau users, you can also try out mapping functions found in this data visualization software, such as layering your data on a map.
7. Visualize Your Sleeping Hours/Habits
If you want to learn how to use Tableau’s charting capabilities and discover your sleep patterns, this project is for you. You’ll be able to use data analytics to learn more about yourself.
For this project, you’ll be visualizing your sleeping hours and habits.
To get started, gather data on your sleeping habits, such as when you go to bed, when you wake up, how long you sleep for, etc. Once you have that data, connect Tableau to it and start creating your visualizations.
You can look at these values:
- The time you go to bed
- The time you wake up
- How long you sleep for
- Number of times you wake up during the night
8. Track Cryptocurrency Prices Over Time

If you’re into cryptocurrency or want to learn more about it, Tableau is a great way to track the prices of various cryptocurrencies over time through data visualization.
To get started, find data on cryptocurrency prices from websites such as CoinMarketCap. You can store this data in one of your favorite relational database management systems like SQLite or MySQL. Once you have that data stored in a database, connect Tableau to it and start creating your visualizations.
You can look at these values:
- The price of the cryptocurrency
- The market capitalization
- The 24-hour trading volume
- The circulating supply
With all this information, you can put create a nice crypto stock exchange analysis dashboard. Be sure to include trend lines using line graphs to show price changes over time.
This project might be useful if you’re looking to enter data analytics in the crypto industry!
9. Investigate Airline Delays and Cancellations
Have you ever been delayed or had your flight canceled? Tableau is a great way to investigate airline delays and cancellations through data visualization.
To get started, find data on airline delays and cancellations from the Bureau of Transportation Statistics. Once you have that data, connect Tableau to it and start creating your visualizations.
You can look at these values:
- The number of delayed flights
- The number of canceled flights
- The reasons for the delays/cancellations
- Which airlines are delayed/canceled the most
Through the exploratory data analysis in this Tableau project, you might even surface the top airlines that have the most issues. Who knows, this information might be useful for your friends and family too!
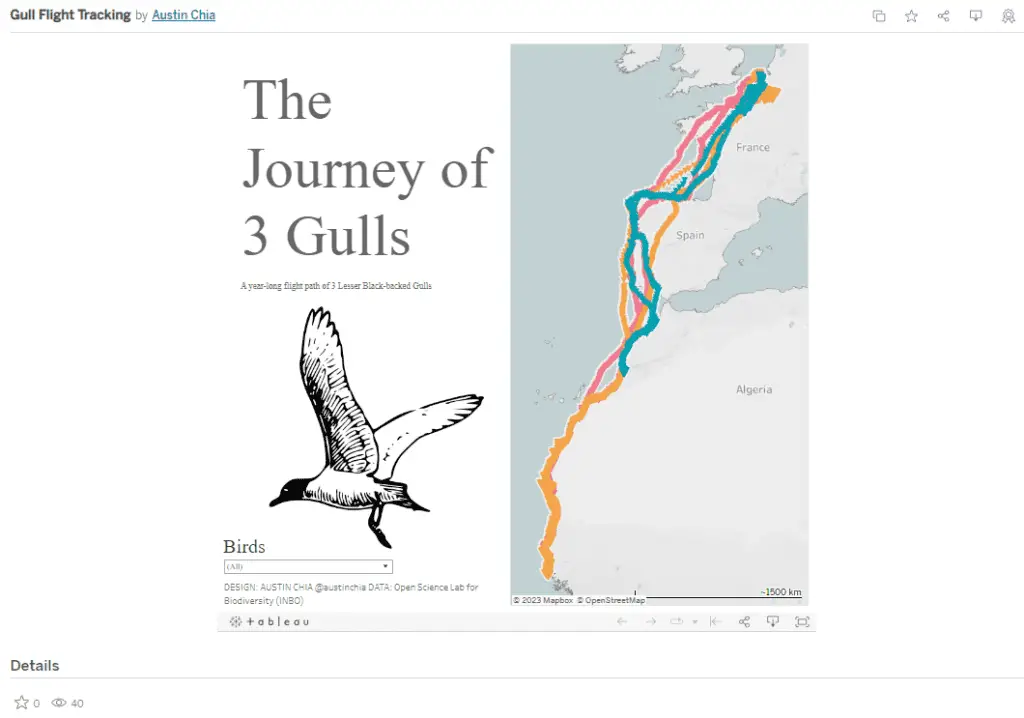
10. Track Bird Migration Patterns Using Data Visualization

Here’s one of the Tableau projects I’m personally interested in—tracking bird migration patterns!
To get started, find data on bird migration patterns from websites such as eBird. Once you have that data, connect Tableau to it and start creating your visualizations.
You can look at these values:
- The number of birds spotted
- The location of the sighting
- The time of year
This project is great for honing your data skills by learning about Tableau’s mapping capabilities too! Through the location data you have, you can produce beautiful data visualizations that make for a great data science project as well.
I’ve actually done a simple data visualization dashboard on this as one of my Tableau sample projects I worked on as a student. Check it out over here on my Tableau Public page.
11. Monitor a Sales Pipeline

If you work in sales or are interested in pursuing a career in sales, Tableau is a great business intelligence tool for monitoring your sales pipeline. This can even include a sales forecast analysis dashboard.
To get started, find data on your sales pipeline from your CRM system. Import that data into a SQL database like the Microsoft SQL Server database. Once you have that data in a database, connect Tableau to it and start creating your visualizations.
You can look at these values:
- The number of leads in each stage of the sales pipeline
- The conversion rate from one stage to the next
- The average time it takes to move a lead from one stage to the next
- The total value of deals in each stage
This Tableau project will be great for understanding how Tableau’s built-in dashboards and sales forecasting features work. Plus, it’ll give you some valuable insights into your own sales pipeline!
Related Questions
Is Tableau worth learning in 2023?
Tableau definitely has a lot of value and is worth learning in 2023. Tableau is a powerful data visualization tool that can help businesses make better decisions. Tableau can also be used for personal projects, such as tracking your fitness progress or monitoring your finances. Tableau is a versatile tool that is constantly evolving, so it’s definitely worth learning.
Can I Learn Tableau in 2 Days?
Tableau is a powerful data visualization tool, but it can be challenging to learn in just a couple of days. Tableau has a lot of features, so it is important to take the time to learn the basics before learning advanced topics. However, it is best to start with the basics and gradually build up skills over time.
Tableau also offers a lot of resources, such as tutorials and books, to help you learn Tableau quickly. For beginners, I recommend a project on an account management dashboard, a patient risk healthcare dashboard, or a global terrorism analysis dashboard.
What is exploratory data analysis?
Exploratory data analysis is the process of viewing and looking at data from different perspectives to learn more about the context, structure, purpose, and behavior of the data. This is usually done through data transformation, data cleaning, and data visualization.
Final Thoughts
There you have it—11 Tableau projects for practices that you can start now.
These Tableau project ideas will help expand your Tableau skillset while also giving you the opportunity to create something that’s visually appealing and impactful. Once you’re done with these, you can even go one step further and create a Tableau Public account to share your work with the Tableau community.
So what are you waiting for? Get started on one of these Tableau projects today!
