
This post may contain paid links to my personal recommendations that help to support the site!
If you’re new to Power BI or just looking for some dashboard inspiration, you’re in luck!
In this blog post, I’ll showcase 3 free Power BI dashboard templates that are perfect for beginners. These templates will be available for free to download. So if you’re looking to find some great templates, do read on!
Here are 3 of my favorites:
- Financial Dashboard
- YouTube Analytics Dashboard
- Website A/B Testing Dashboard
I’ve chosen to include dashboards from different common business use cases in Power BI. They were also designed to be simple and easy for beginners learning Power BI for the first time.
Let’s have a detailed look at each of them!
1. Financial Dashboard
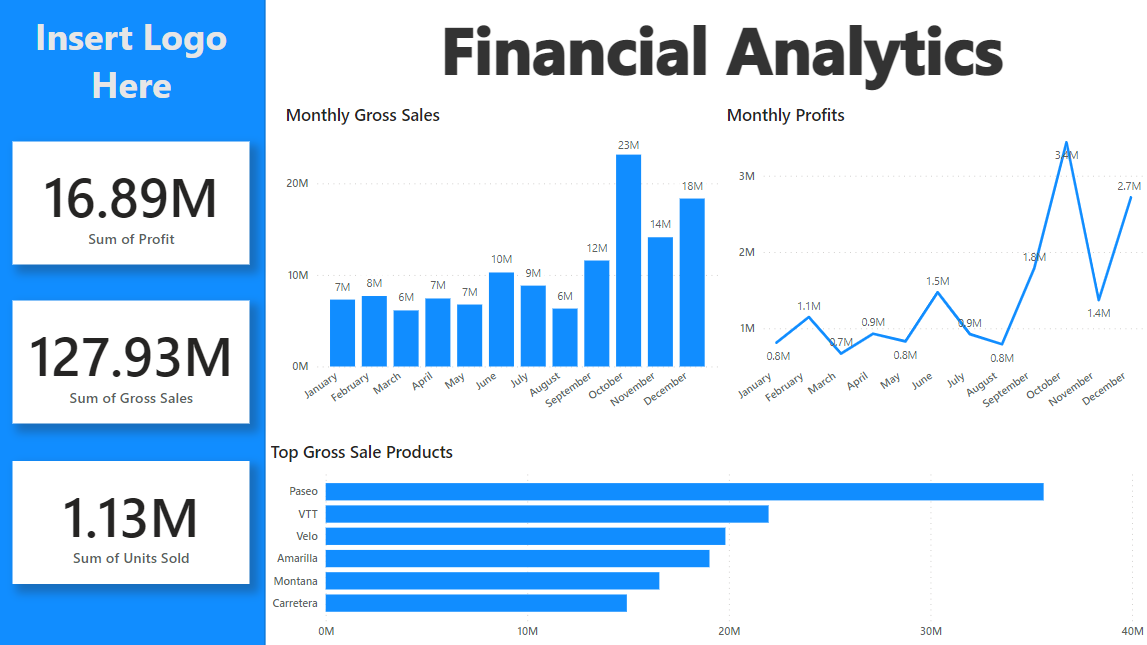
First up, this beginner-friendly Power BI dashboard template is perfect for those who want to get a quick overview of their financial situation. It includes visualizations of gross sales, profitability, and more.
The design of this dashboard is focused on simplicity, where all the key metrics are highlighted on the left using Power BI Callout Cards. This dashboard is useful for business financial analysis, where you’ll need a quick overview of your financial data.
How to download and use the templates:

- Download the pbit file on your machine
- Open the pbit file on the Power BI Desktop application
- Edit the template and insert your own data accordingly
2. YouTube Analytics Dashboard
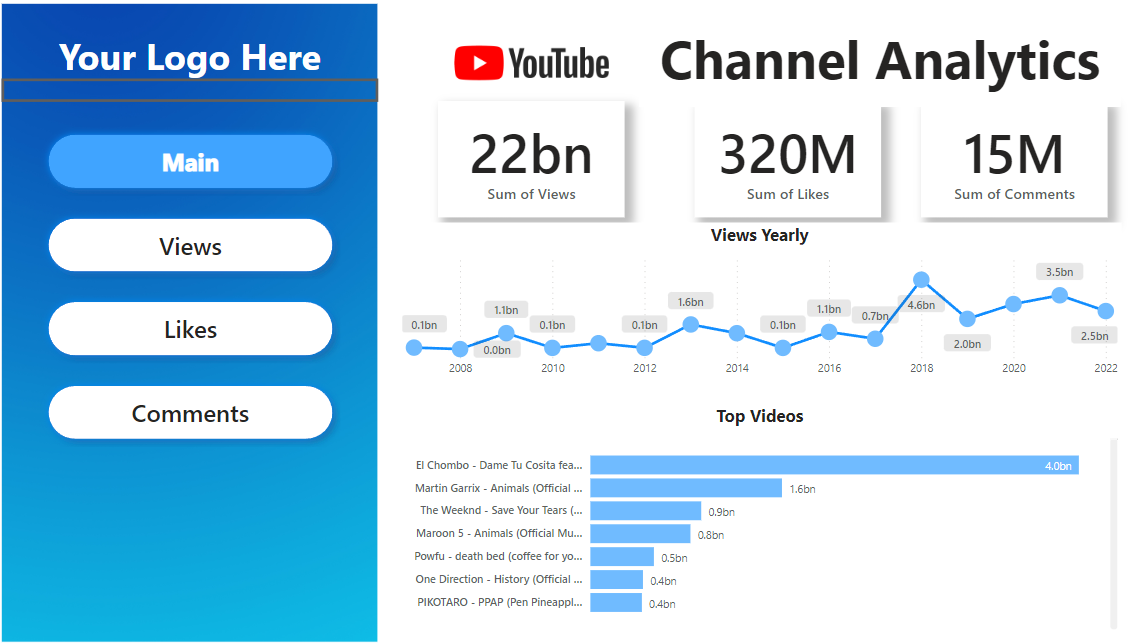
Next, this Power BI dashboard template is perfect for those who want to track their YouTube channel performance. It includes visualizations of subscribers, video views, and more.
This dashboard will be useful if you’re keen to learn more about Power BI, especially on the navigation buttons! This dashboard has multiple navigation buttons on the left-hand side to help users access more in-depth data if there’s a need to investigate deeper.
The visualizations on the right are slightly more complex than my previous dashboard—there are callout cards, line charts, and bar charts. However, the dashboard does not look cluttered as some of the axis lines are cleaned up.
3. Website A/B Testing Dashboard
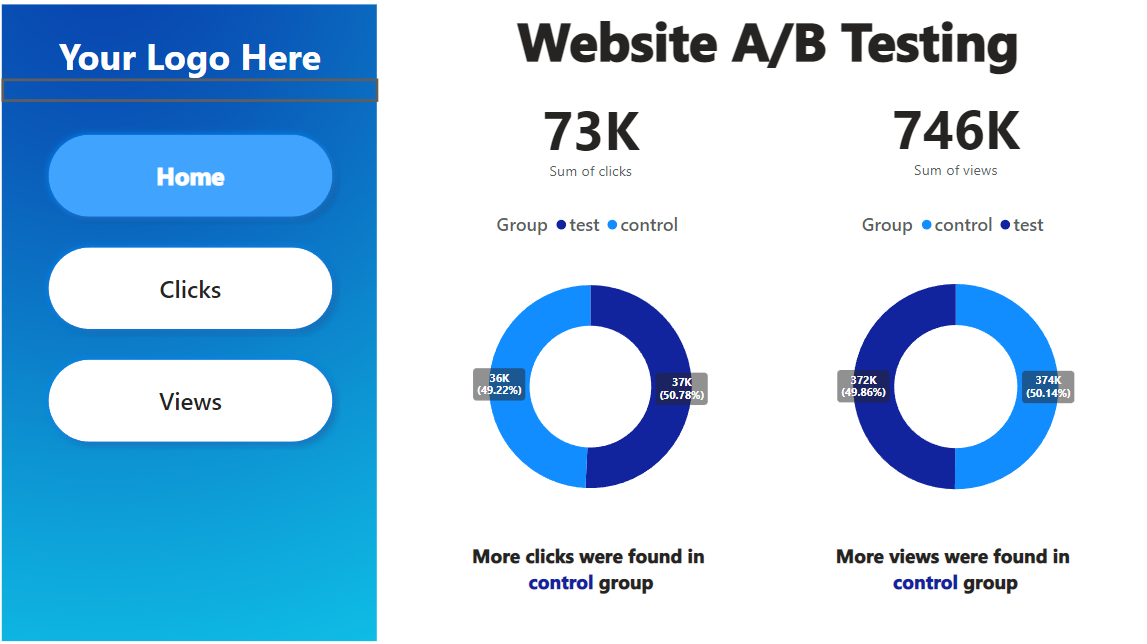
Lastly, my final Power BI dashboard template is perfect for those who want to track the performance of their website’s A/B tests. It includes visualizations of click-through rates, views, and more.
If you’re working on a website or assessing the success of a marketing campaign, you would need a good monitoring dashboard like this to present your findings to your stakeholders.
In this dashboard, we have navigation panels on the left to drill down to the details for each metric, as well as donut charts to visualize the split between A/B (test/control) groups.
Final Thoughts
There you have it—three beautiful Power BI dashboard templates for beginners, all available for free! I hope these templates will give you some inspiration for designing your own Power BI dashboards. Do experiment with the different visualization types and navigation buttons to see what works best for you.
All the best in creating your own beautiful Power BI dashboards!