This post may contain paid links to my personal recommendations that help to support the site!
Tableau Sets and Groups – what exactly are the differences? Similarly, this question came across my mind one day while working on some data but I thought it would be great to put together a comparison analysis of Tableau Sets VS Groups.
The difference between Tableau Sets and Tableau Groups is that Sets are used to form subsets of data, based on the conditions chosen but Groups puts dimensions together and create a hierarchy of multiple dimension levels. Both are applied in different situations, depending on how fields need to be aggregated.
Therefore, in this post, I will be sharing some information that I’ve gathered on the definitions of both Sets and Groups as well as some additional ways for you to use them.
Tableau Sets VS Groups – What are they?
Having sets and groups in Tableau can be a great way to organize data into the structure that we want. However, not many know the exact differences between how each method works and when to apply them. Tableau offers different types of sets for varied uses.
Tableau Sets
As mentioned above, sets create two different results – IN or OUT of the set that you choose.
Tableau sets are usually split into either 1 of 2 types – the Constant sets and the Dynamic sets.
Each type of set carries a different function that we can make use of once we know the details! But don’t worry about that, I’ve compiled some information for each type, which I will be sharing with you here.
Tableau Constant Sets
Constant Sets contain data has members that cannot be changed as they are fixed. I will be using the Sample – Superstore data as my dataset for a demonstration and screenshots. This dataset can be found built-in with every copy of Tableau Desktop. I would recommend that you follow step-by-step for better understanding.
Data and Chart Preparation
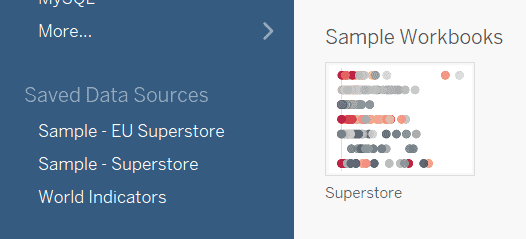
To begin, firstly, access the Sample Superstore dataset from the Tableau data source menu shown in the screenshot below. This should be under the Saved Data Sources section on the left panel.
Upon connecting to the Superstore data, I would like to demonstrate how a set can be created on some location data through a filled map. In this example shown below, I created a filled map of the Country/Region dimension, State dimension and the sum of the sales for each state.
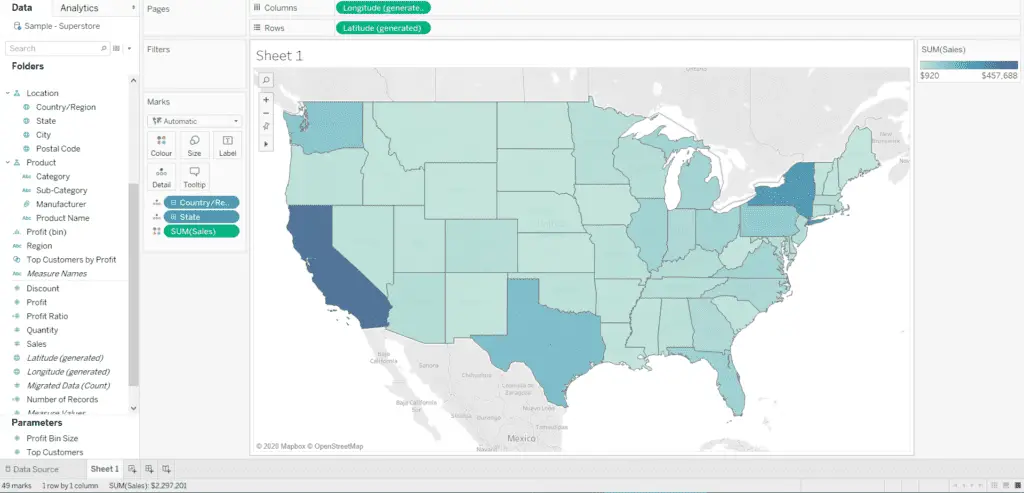
To recreate this map, simply double click on the State dimension in the data panel on the left as well as the Sales measure in the left panel. By default, the State dimension is added to the chart automatically, which generates two different measures – Longitude and Latitude. Additionally, the Country/Region dimension is included automatically as well.
Converting a Symbol Map to Filled Map
This generates a simple symbol map, but what we need for better representation is a filled map. To convert this symbol map into a filled map, simply click on the Show Me button on the top-right corner to reveal a dropdown of chart options. From that dropdown, select the Filled Maps option. This should be beside the symbol map option. These steps should bring you to a simple filled map with information on the sales for each state.
How to Create a Constant Set in Tableau:
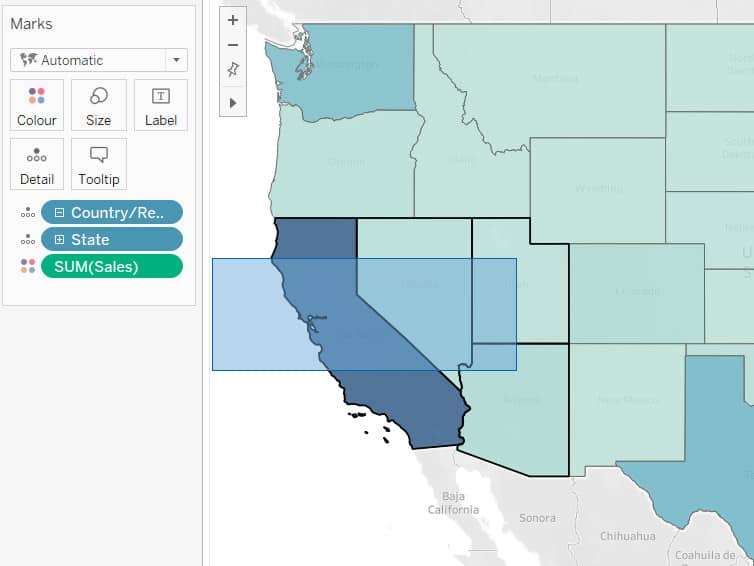
To create a constant set from the filled map, highlight a portion of several states on the map. Make sure to only highlight the states that you want to be included in this set. The screenshot below shows the 4 states that I would be creating into a set. I chose the states of California, Nevada, Utah, and Arizona to be part of the set.
Once you have selected the states that you need for your set, a small popup should appear the selected areas. In the popup, click the set icon and select Create Set in the dropdown that appears. This set icon should look like two interlinked circles.
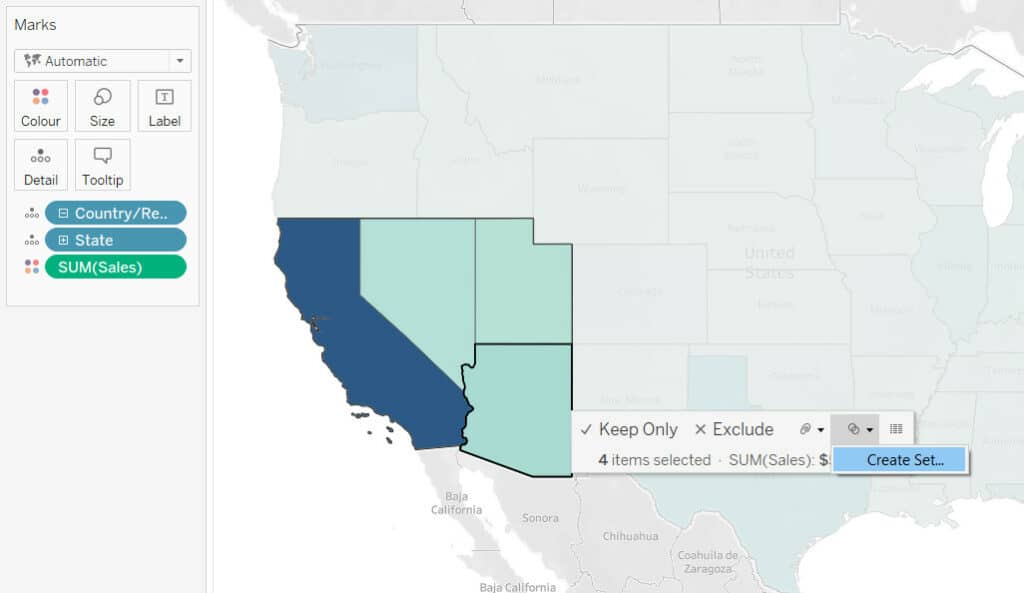
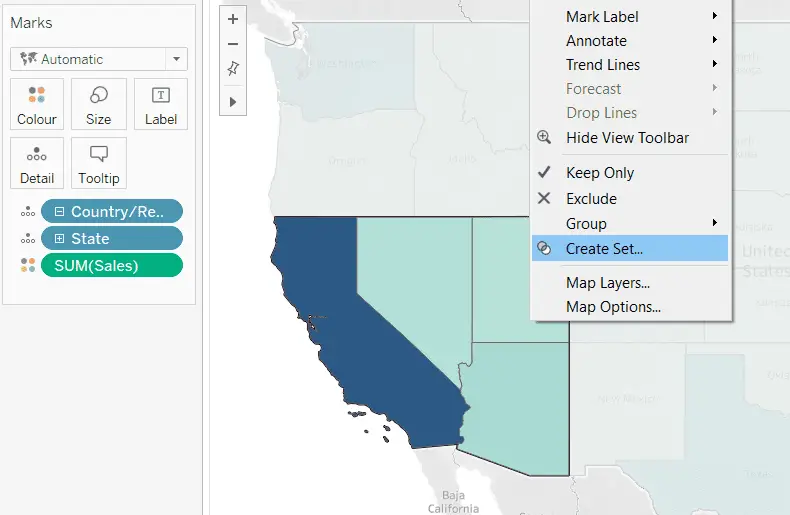
In the case where the popup disappears, you can open up a similar menu by right-clicking any point on the selected areas. In the menu that appears, select Create Set to achieve a similar result as the method mentioned above.
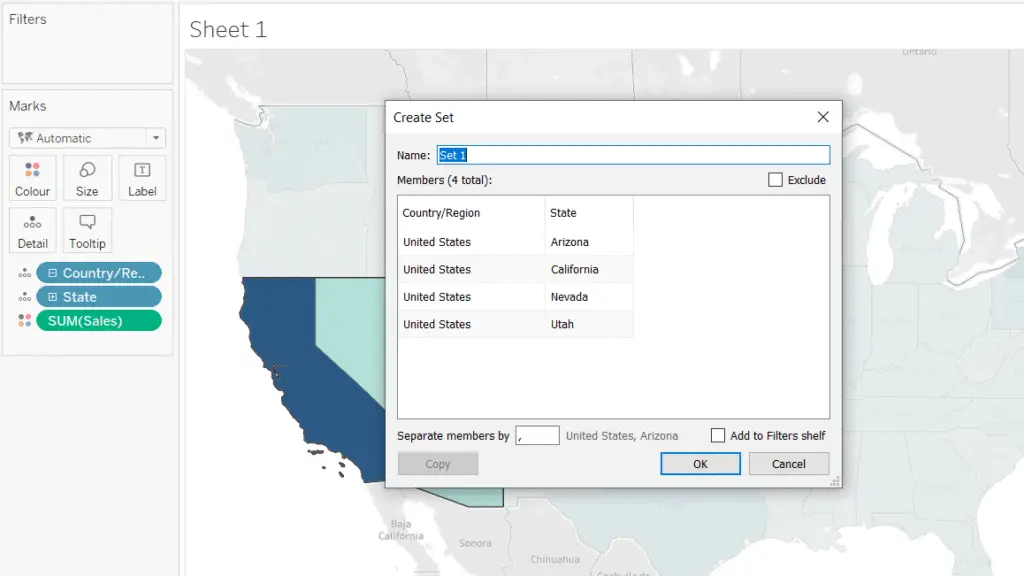
By following the steps above carefully, you should have a Create Set dialogue window appear to name the set that you want to create. For the Name field, you can name the set according to your preference. In the Members field, a list of states will be shown to provide a quick preview of what will be going into your set.
Naming Sets
In my example, I have chosen to go with naming my set as “Set 1” which is the default set name. Your set name does not matter much, but try to choose a name that represents your set well or one that makes sense for your data. Once you have checked that all fields are correct, finish the process by clicking on the OK button.
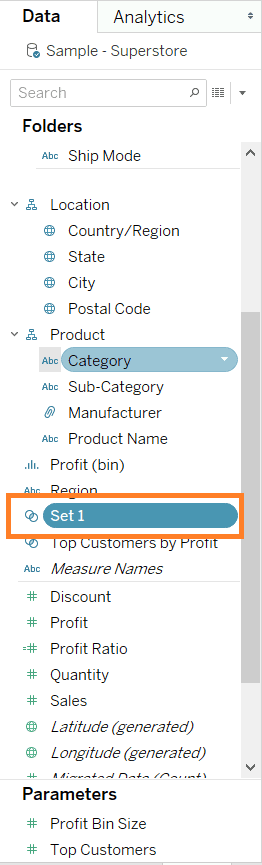
Your set has been created! The new set you have just created should appear on the data panel on the left. On my screenshot below, my new set “Set 1” has appeared, with the set icon as a label. Your set is now available to use as a dimension.
Visualizing a Constant Set
Now that our set has been created, let’s present it on our filled map. To visualize the set, simply double-click on the set dimension you have just created or drag the pill to the Rows shelf. In my example, I added “Set 1” to the rows shelf. The result of including “Set 1” to my filled map is two different maps – one with IN and the other OUT.
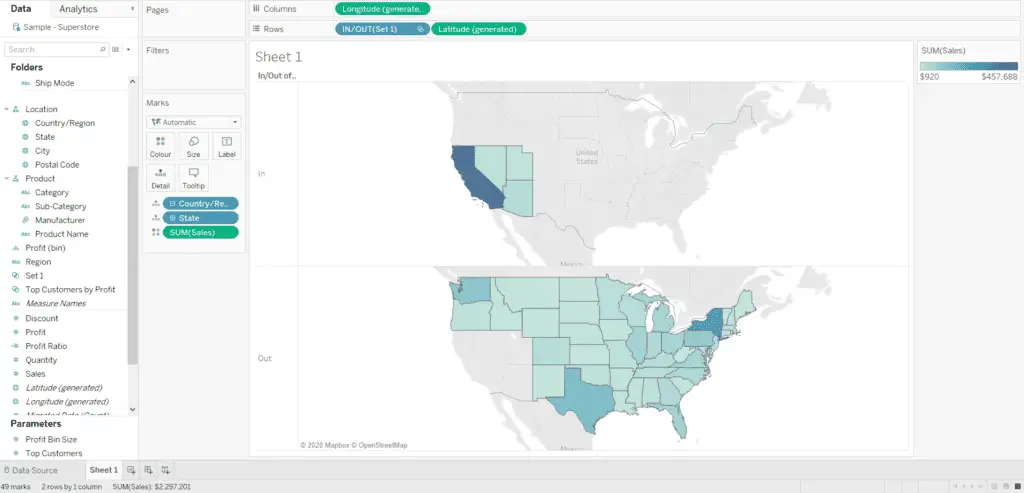
Referring to the screenshot above, you will observe that those states that I have selected for the constant set have been grouped together into the IN of “Set 1”. The IN members of a set includes the states of California, Nevada, Utah and Arizona and because they are made into a set, non-members are put together separately into the OUT category.
Tableau Dynamic Sets
Dynamic sets in Tableau are similar to the Constant sets, except that they are based on calculations and are computed. Due to the dynamic nature of such sets, any changes to the data can be updated automatically. To demonstrate how to create dynamic sets, I will use the same Sample – Superstore dataset.
Data and Chart Preparation
In this example, we will be looking at creating a dynamic set to find out the city that has generated the highest profit. To begin, double-click the Profit dimension and set it to aggregate as a sum. This is to show the Profit numbers. This should result in a bar chart being plotted automatically. Now you are ready to create a dynamic set.
How to Create a Dynamic Set in Tableau:
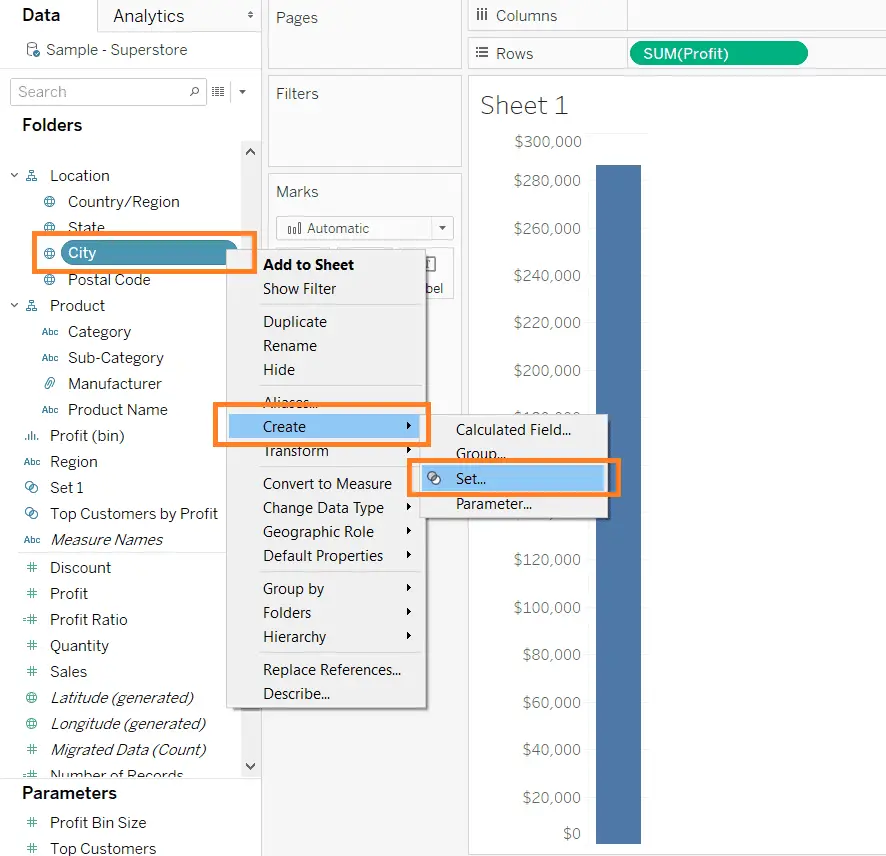
Firstly, mouse over to the City dimension and click the dropdown arrow, followed by Create and then Set. The Set option should have the set symbol (two interlinked circles) next to it. The screenshot below shows the steps in this process in orange boxes.
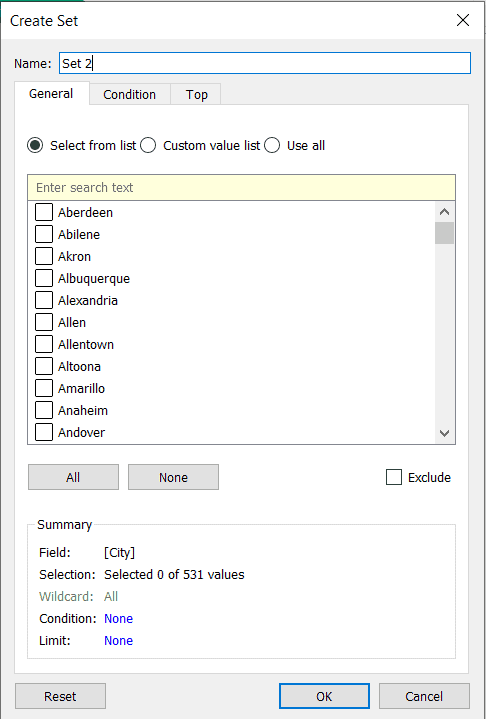
Next, a dialogue box “Create Set” should pop up automatically. This dialogue box has several tabs and options to select from. In the General tab, we are shown an option to either select from the list of cities, create a custom list or use all of the cities as members for our set.
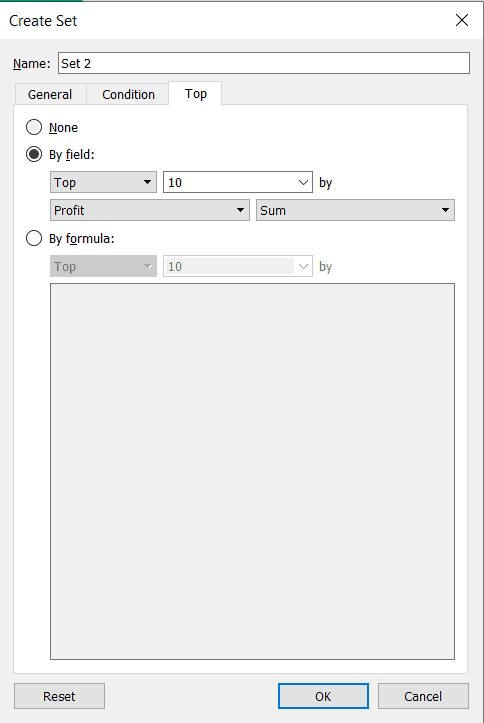
For our case, we would be looking at the Top tab to create a set that groups the top 10 cities by profit. To achieve that, navigate to the Top tab and select By field. Select Top for the dropdown and type in 10 next to the dropdown. Next, select Profit and Sum as the field, and once that is set, click on OK. The screenshot below shows an example of the dialogue box with the Top tab.
Visualizing a Dynamic Set
As a result, we have created our dynamic set. Our next steps are to visualize this set on our bar chart. Simply double-click on the newly-created set to include the set in your visualization. Similar to the constant charts, the set splits the chart into IN and OUT. Members in the IN category belong to your defined set (in this case, Top 10 cities with profit) and those in the OUT category do not belong in the defined set.
Tableau Groups
Tableau groups work differently from sets and are created using a different process from Sets.
How to Create Groups in Tableau
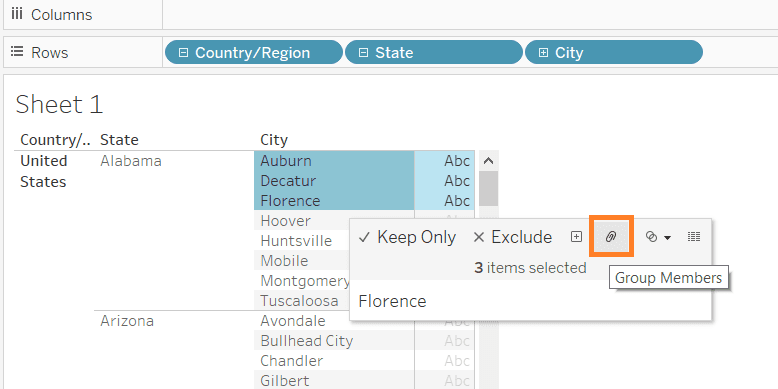
Firstly, begin by adding the City dimension to the Rows shelf to provide some data. Secondly, hold CTRL/CMD and click to select the relevant cities to be grouped. Lastly, click on on the Group icon on the popup window to group the cities (The group icon looks like a paperclip, shown in the orange box in the screenshot below).
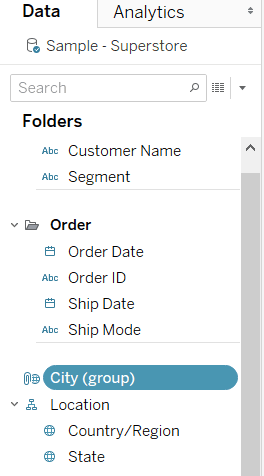
As a result, once you create the new group, a new dimension shows up in the data panel on the left. In my example, a group called “City (group)” was created. This new dimension is created in addition to the original City dimension and they do not affect each other.
All ready to learn more about Tableau? Check out this list of 7 clever ways to learn Tableau I wrote over here.
Final Thoughts
Sets and groups in Tableau work in different ways but they both aggregate data and dimensions. The Tableau sets show splits of members IN and OUT of the set and provide either constant or dynamic types. However, the Groups in Tableau are used more on dimensions and custom grouping them together.
I hope you have learned something in this tutorial/article on Tableau Sets VS Groups! Thanks for reading.
For more content on Tableau check out the Tableau Category Archive here.
My Favorite Learning Resources:
My Recommended Learning Platforms!
| Learning Platform | What’s Good About the Platform? | |
|---|---|---|
| 1 | Coursera | Certificates are offered by popular learning institutes and companies like Google & IBM |
| 2 | DataCamp | Comes with an integrated coding platform, great for beginners! |
| 3 | Pluralsight | Strong focus on data skills, taught by industry experts |
| 4 | Stratascratch | Learn faster by doing real interview coding practices for data science |
| 5 | Udacity | High-quality, comprehensive courses |
My Recommended Online Courses + Books!
| Topic | Online Courses | Books | |
|---|---|---|---|
| 1 | Data Analytics | Google Data Analytics Professional Certificate | – |
| 2 | Data Science | IBM Data Science Professional Certificate | – |
| 3 | Excel | Excel Skills for Business Specialization | – |
| 4 | Python | Python for Everybody Specialization | Python for Data Analysis |
| 5 | SQL | Introduction to SQL | SQL: The Ultimate Beginners Guide: Learn SQL Today |
| 6 | Tableau | Data Visualization with Tableau | Practical Tableau |
| 7 | Power BI | Getting Started with Power BI Desktop | Beginning Microsoft Power BI |
| 8 | R Programming | Data Science: Foundations using R Specialization | Learning R |
| 9 | Data Visualization | – | Big Book of Dashboards |
More Articles For You