This post may contain paid links to my personal recommendations that help to support the site!
I still remember when I first had the idea to start a data science project of my own and my first thought was: How long would a data science project take me?
I’ve done the research and here’s a summary:
It will take between 2 weeks to 6 months to complete a typical data science project. The project length can vary largely based on the data volume, processing time, and project team size. Therefore, the duration of data science projects may vary according to the resources and needs of the project.
Data science projects usually involve several stages that vary in duration depending on several factors. These factors can typically shorten or lengthen the project overall. Let’s have a look at each stage and how long each of them may take.
What are the Stages of a Data Science Project and How Long Do They Take?
Stage 1. Data Collection

To begin with any data science project, you would have to start collecting some data from various data sources. I’d say that this can potentially be the longest yet most crucial step of your data science project. Because what’s data science without data, right?
Why would the collection take long? That’s because this stage requires a strong understanding of databases and how your data is stored. Depending on the databases you work with, you can be working with flat text files like CSV (Comma Separated Value) files and Microsoft Excel files to relational databases in MySQL. Other common data sources include non-relational MongoDB as well as Web APIs.
These databases require knowledge of a varied data stack, which can be a problem when starting your first data science project. At this stage, data blending and joining through Structure Query Language (SQL) is common. Depending on the skill level of SQL, this process may stretch the duration of your data science project.
Additionally, if the datasets are large (tens of millions of rows), then the process of gathering data might be extended.
Time Required: 2 Weeks OR 20% of your project timeline
Stage 2. Data Cleaning

The next step in your data science project is to process the data by ensuring that it is clean. And by clean, I mean that data must be of consistent formats, free from duplicate records, free from missing values, and placed in a structured form. Who doesn’t like it when things are clean and tidy? Ok, some may enjoy organized messes but please remember the number one rule of data science.
“Garbage In, Garbage Out”
Every successful data scientist
This process of tidying data can be very time-consuming, so expect most of your time to be spent doing work during this period. Messy data can really affect how long your data science project may last. This is likely due to the noise from the combination of multiple disparate data sources.
Despite taking up the longest duration of your project, this essential stage is what would make your project an impactful one that can bring true insight from your models later on.
As this stage requires quite a hefty amount of technical skills, I would say that this process of cleaning may easily take up half of your project time.
Time Required: 5 Weeks OR 50% of your project timeline
Stage 3. Data Exploration
By this stage, all your data should be clean and tidy except that it is not quite ready for interpretation as of yet. This is where the science in data science comes from. Through the exploration of data, we can uncover useful trends that can lead to a hypothesis to be tested against.
Exploration should consume much lesser time than before, with simple descriptive analysis and visualizations from common packages such as ggplot2 or Matplotlib. This can be enhanced through the use of Business Intelligence (BI) tools like Tableau and Microsoft Power BI to give quick analysis and detection of trends. Therefore, you should expect a much shorter period of time for your data exploration.
Time Required: 1.5 Weeks OR 15% of your project timeline
Stage 4. Data Modeling
This is the stage most people come to data science for. This is where some may say that math can become magic! The first step in this stage is to select all of the features (or data points) you actually need to start building your data science model.
This process of feature selection may be the longest part of this stage.
Once you are done with the selection, a model is typically trained on a training dataset. This model then makes predictions based on the model you have built.
Although this stage may require more technical knowledge, it would not consume much time once the features are selected carefully. Oftentimes, one would just need to run an algorithm from a package such as caret in R or Tensorflow in Python. The execution is done mostly through computational means and automation speed will vary depending on the processor resources available.
Time Required: 1 Week OR 10% of your project timeline
Stage 5. Data Interpretation

Now that our model has made some substantial predictions, you need to share this insight with someone! Data interpretation is the final stage of our project, where you will present any findings and possible improvements to previous models. In a business analytics setting, a data scientist would share his model results and interpret them in a manner that a layman would understand.
As this stage does not require any technical skills, there should be no reason why it should take a large portion of your project timeline. A majority of the time spent in this stage is putting together visualizations based on the model predictions.
Time Required: 0.5 Week OR 5% of your project timeline
Stages of a Data Science Project
1. Data Collection
2. Data Cleaning
3. Data Exploration
4. Data Modeling
5. Data Interpretation
After running through the stages, you should now have a bigger picture of which part of a data science project should take you the longest time. However, projects are done at very different levels – some are analytics-focused and others are heavy in machine learning.
Now, let’s look at which factors would affect how long your data science project can last.
What Factors Can Affect the Duration of a Data Science Project?
1. Volume of Data
If the data is large and comes in a few hundreds of millions of rows, one should expect more time for the queries to run during the data collection stage as well as the algorithms during the data cleaning stage.
Essentially, more data means more processing time, which can really add extra weeks to your project.
2. Tidiness of Data
If you’ve had a look at an untidy Excel sheet before, you’ve probably seen this coming. If data comes from multiple varied sources, messy data can be a nightmare to solve. More time would naturally go into arranging and organizing these data, adding on to your project duration.
3. Technical Expertise Level
This applies to almost all data-related projects. If data scientists can write efficient, less memory-intensive code, they can potentially speed up processing times.
Other the other hand, someone relatively new to data like myself, would struggle to handle more complex data scrubbing work.
4. Resources Available
Just like in any project, resources are always key to how fast a project can move forward. For the case of data science, sufficient computing power may be required for computationally intensive algorithms.
A project with less budget would suffer slower runs of model training and lengthen project duration.
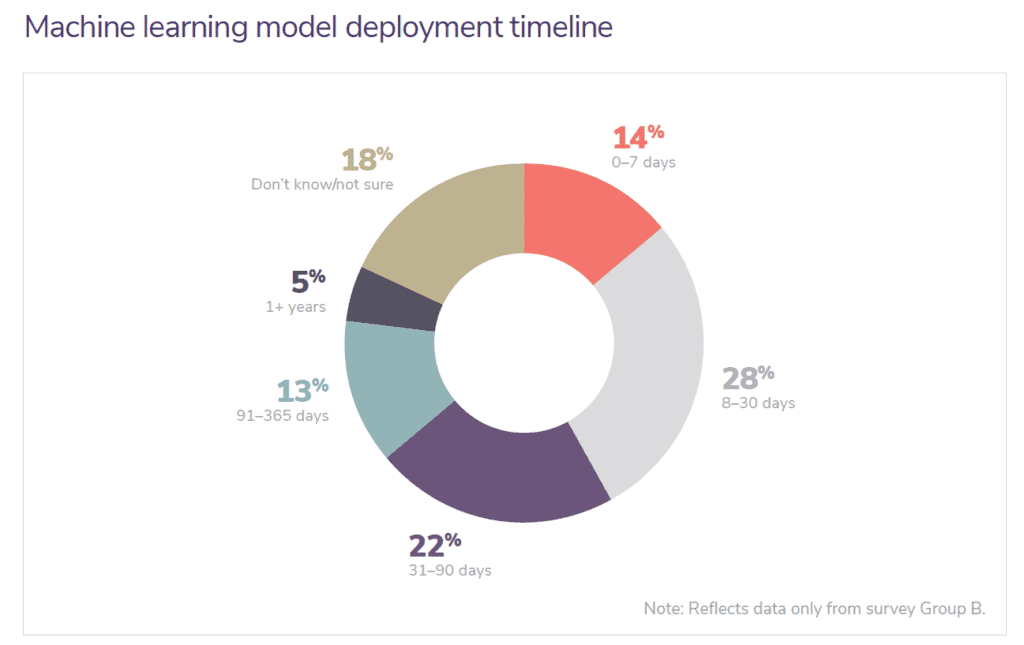
Here’s a diagram to better understand the duration of a typical data science project, taken from a study by Algorithmia’s “2020 State of Enterprise ML.”

As you can already see from the diagram above, the timeline to train a machine learning model can vary very vastly across different individuals. This proves that data science projects can really have durations of all lengths!
Related Question
Where Can I Find Good Data Science Projects for Learning?
Most beginners in data science would look to Kaggle for interesting projects and datasets. Kaggle is a great resource that provides data science problems as well as accompanying datasets for data whizzes like you to mess around with. These problems are great for self-learning and developing new skills in data science.
Conclusion
Data science projects are always different and change in demands depending on the problem you are looking to solve. Therefore, these projects can vary in duration by quite a fair margin. Hope this helps you in starting a data science project of your very own!
My Favorite Learning Resources:
My Recommended Learning Platforms!
| Learning Platform | What’s Good About the Platform? | |
|---|---|---|
| 1 | Coursera | Certificates are offered by popular learning institutes and companies like Google & IBM |
| 2 | DataCamp | Comes with an integrated coding platform, great for beginners! |
| 3 | Pluralsight | Strong focus on data skills, taught by industry experts |
| 4 | Stratascratch | Learn faster by doing real interview coding practices for data science |
| 5 | Udacity | High-quality, comprehensive courses |
My Recommended Online Courses + Books!
| Topic | Online Courses | Books | |
|---|---|---|---|
| 1 | Data Analytics | Google Data Analytics Professional Certificate | – |
| 2 | Data Science | IBM Data Science Professional Certificate | – |
| 3 | Excel | Excel Skills for Business Specialization | – |
| 4 | Python | Python for Everybody Specialization | Python for Data Analysis |
| 5 | SQL | Introduction to SQL | SQL: The Ultimate Beginners Guide: Learn SQL Today |
| 6 | Tableau | Data Visualization with Tableau | Practical Tableau |
| 7 | Power BI | Getting Started with Power BI Desktop | Beginning Microsoft Power BI |
| 8 | R Programming | Data Science: Foundations using R Specialization | Learning R |
| 9 | Data Visualization | – | Big Book of Dashboards |

