
This post may contain paid links to my personal recommendations that help to support the site!
If you’re someone who’s just beginning your career in data analytics like me, chances are you’re going to run into some questions like what’s the difference between a Data Analyst and a Business Intelligence (BI) Analyst?
Here’s a short answer:
A data analyst solves problems only through analytics but a business intelligence analyst discovers business-focused insights through data. Both roles are relatively similar in definition, process, type of data, and type of analysis, except for the type of tools used, which may vary slightly.

What is the difference between a Data Analyst and a Business Intelligence Analyst?
Here are the 7 key differences:
| Factor | Data Analyst | Business Intelligence (BI) Analyst |
|---|---|---|
| 1. Definition and Goals | Identifies and solves problems through analytics and statistical models using data analytics, programming, and statistical models. To solve complex problems within an organization by breaking them down into quantitative values. | Discovers business-focused insights that lead business decisions using data warehousing and BI tools. To provide intelligence to a business using an evidence-based approach. |
| 2. Process | Follows data analytics lifecycle – understands end-user, collects necessary data, cleans and analyzing data, creating visualizations to present insights | Understanding the needs of the business end-user, querying from the respective databases and joining them, inputting the data into an easily digestible dashboard or report to highlight any key insights. |
| 3. Data | Wider variation of data; can be unstructured, messier data | Structured, processed from data warehouses |
| 4. Type of Analysis | Investigational, specific, and ad-hoc analysis | Structured and periodical analysis |
| 5. Skills and Tools Required | Python R SQL Tableau/Power BI | SQL Excel Tableau/Power BI ETL tools |
| 6. Education Level | Bachelor’s Degree | Bachelor’s Degree |
| 7. Salary | USD$73,678 (US) | USD$69,526 (US) |
I assumed that the best way for me to present a quick overview of all these comparisons was through a summarized table.
So if you’ve already arrived at your answer, go ahead and screenshot this table and save it for further reference.
However, I would say that not all the aspects can be covered within such a limited space.
If you’d like a deeper analysis of the two data positions as well as my personal opinion (as a data analyst) on the two roles, keep reading because I’ll be revealing more information and caveats below!
Introduction
You might be wondering: Is there more information about the two roles? What exactly are the biggest differences and similarities among the 2 that REALLY stand out?
Here’s an overall comparison of the differences and similarities between a data analyst and a business intelligence analyst.
Main Differences

The data analyst and the BI analyst do have some big differences between them if you do look hard enough!
The first main difference is that the BI analyst focuses on creating business insights through the querying of databases and the creation of reports whereas the data analyst would be involved in data analysis across a wider scope of data within a company.
For example, the data analyst may be involved with deeper analysis work on marketing data to understand customer segments.
Some of that may include developing statistical models to further analyze data. A BI analyst may just be creating reports of that same data to detect any trends or anomalies in the data.
Secondly, the BI analyst uses more skills that will enable data warehousing, such as SQL as well as BI visualization tools to generate dashboards and reports.
They also use it to create BI pipelines from these warehouses. However, the data analyst would be using more programming and statistical packages such as Python and R.
Not to be confused with business analysts, BI analysts focus more on the technical side of things.
Main Similarities

- Quantitative and analytical in nature
- Relatively similar work processes
- Pay range
1. Definitions and Goals
a) What is a Data Analyst?

A data analyst identifies and solves problems through analytics and statistical models to provide insight and drive decisions within an organization. These include the use of programming, statistical models, and data visualization software. The role of a data analyst is a general position that may be found across several business functions.
According to the U.S. Bureau of Labor Statistics, data analysts are found across all aspects of an organization. They use computer software such as statistical packages, computer programming languages, and databases to build insights.
A data analyst is also an IT job, which is less known among many. Although they do not have IT support functions, data analysts are involved in computing and can be considered IT jobs.
Curious to know more? Check out my other article over here.
A common question that people ask about data analysts is if they can work from home. You can read all about that in my other article over here!
b) What is a Business Intelligence Analyst?

A business intelligence (BI) analyst discovers business-focused insights using data within an organization that leads business decisions. Their job would include the use of data warehousing, data modelling, and BI software tools to arrive at these insights.
Focusing on providing business value, BI analysts generally create more data visualizations for insight.
According to the occupation profile on Careeronestop, a BI analyst produces reports from querying and analyzing data from data repositories such as data warehouses. They also identify trends in the data for insight to drive business decisions.
b) Goals

Both roles were created to achieve similar goals – to better improve a company’s operations through the use of available data by making data-driven decisions.
Data Analyst: The goal of a data analyst is to solve complex problems within an organization by breaking them down into quantitative values and analyzing raw data for trends that can be used for optimization.
BI Analyst: The goal of a BI analyst is to provide intelligence to a business using an evidence-based approach, which is brought about through analyzing data from the business.
2. Process

Data Analyst: The work processes of a data analyst are typically broken down into something similar to the data analytics lifecycle.
- It begins with working with stakeholders to understand their needs and translating that into a quantitative problem.
- Next would be ensuring the proper collection of primary data sources that can solve the quantitative problem, followed by acquiring the data.
- The next step would involve cleaning the unorganized data into a format that is readily available to conduct a fair statistical analysis or a chart on a dashboard.
- The last step is to generate charts or present analysis to respective stakeholders to recommend certain optimizations.
BI Analyst: The work processes of a BI analyst differ from the data analyst slightly. A BI analyst would begin with understanding the needs of the business end-user. The next step would be to query from the respective databases available (such as a data lake or data warehouse) and join them together to get all the data needed to identify the necessary trends. The last step typically ends with inputting the data into an easily digestible dashboard or report to highlight any key insights.
3. Data

The type of data used in the two different roles can vary depending on the project and work required. Let’s have a general look at what data does each of them typically uses.
Data Analyst: The data analyst would be dealing with more unstructured and disorganized data. Depending on the project this may come in a wide range of cleanliness.
For example, when given a project that involves web scraping using Python to collect data from websites, a data analyst would have low-quality data gathered on an ad-hoc basis . Such data would subsequently have to be cleaned for proper analysis.
BI Analyst: The BI analyst would be handling slightly different data. With the focus on generating periodic reports that are used to identify trends, the data is usually fixed as a few specific metrics or data points .
Because these data are regularly cleaned and ingested into data warehouses by data engineers, there has been some form of cleaning done by the Extract Transform, Load (ETL) process.
Data is produced periodically and is well-structured for analysis.
The challenge for BI analysts would be joining varied data tables in the data warehouse. The data might start to be slightly messier after joining.
4. Type of Analysis

Let’s compare the type of analysis done by both of the roles!
Data Analyst: A data analyst would be looking at more impromptu analysis, where data analysis may be required from stakeholders for a specific investigational purpose.
For example, the marketing depart might want to dive deeper into the data to understand customer segments or the effectiveness of an advertising campaign. An A/B statistical test might be needed.
In such cases, the type of analysis would be more specific and random. Due to the specificity of the analysis, work can be quite heavy and deep when analyzing statistical models.
BI Analyst: The BI analyst would have an analysis that might be more periodical and structured. Because the main intent of the business intelligence is to identify deviations from the usual trend, a consistent, recurring analysis has to be done.
Business intelligence analysts also require skills in business analytics, which involves the critical analysis of business processes by looking at their data.
5. Skills and Tools Required

As mentioned above, the two roles would require a slightly different set of tools to carry out their specific functions effectively. Let’s have a look at the different tools used by both of them.
Data Analyst:
- Python
- R
- SQL
- Tableau/Power BI

The data analyst has tools with a greater focus on having the versatility to clean messy data as well as programming languages that provide statistical packages for analysis.
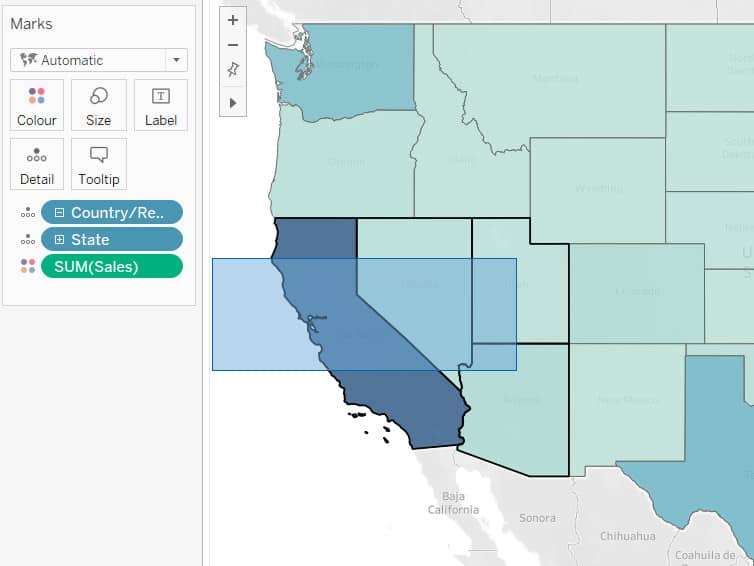
Tableau is the most common data visualization tool used among data analysts. If you’re curious to learn more about Tableau, go check out my other article on Tableau here.
Common Tools Used by BI Analysts:
- SQL
- Excel
- Tableau/Power BI
- ETL tools
SQL is hands down one of the most used languages by BI analysts that I know on Linkedin. With so much work being done through querying from data warehouses, SQL is the tool of choice for many.
Want to know more about SQL? Here’s a post I wrote about a commonly mistaken perception of SQL here.
The BI analyst has tools that enable them to work with structured data in an efficient manner. The use of BI tools also matches their goals of having to provide intelligence to a business through data visualizations.
6. Education Level
In general, both roles do not have fixed education levels requirements for positions. Due to how recent these roles have appeared over the past few years, it can be tough to understand what educational requirements companies need.
Let’s have an overall look at some statistics I’ve found on the educations levels for both roles!
Data Analyst:
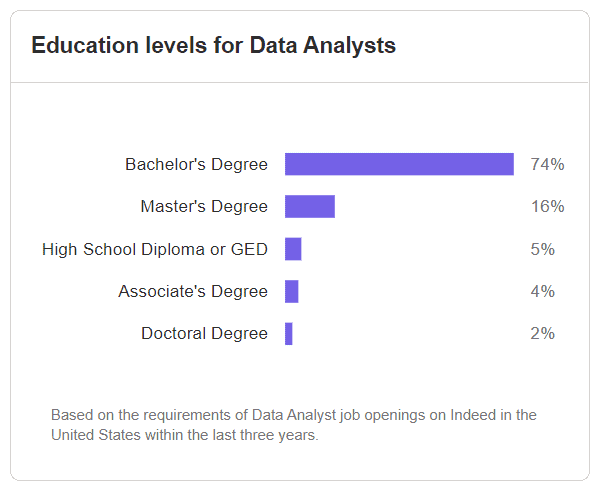
According to Indeed.com, a large majority of 74% of data analyst positions in the US were taken by Bachelor’s Degree holders. This means that a Bachelor’s Degree would be sufficient for an application for a data analyst position.
However, I am someone who believes that learning beyond a degree is also as important!
If you’re thinking of applying for a data analyst, you might want to consider pursuing a data analytics certificate, just like this one by Google, to boost your chances of landing that job! I’ve made a review of that over here.
BI Analyst:
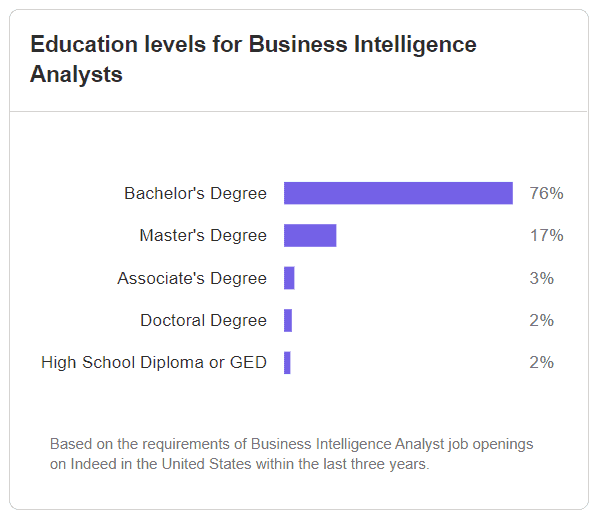
According to Indeed.com, a large majority of 76% of BI analyst positions in the US were filled by Bachelor’s Degree holders. Most BI analysts would require a minimum of a Bachelor’s Degree.
This also means that BI analysts are generally not at the stage of pursuing post-graduate studies.
Similar to the data analysts, having a Bachelor’s Degree would put you in good standing among the other job applicants.
7. Salary

Data Analyst:
As found on Indeed.com, a Data Analyst makes an annual average base salary of USD$73,678.
Now, this number might seem quite high and tempting to jump right into but do consider the fact that the data analyst role is a very varied and ill-defined one.
This salary would include salaries distributed across a wide range of experience levels from entry-level to senior roles.
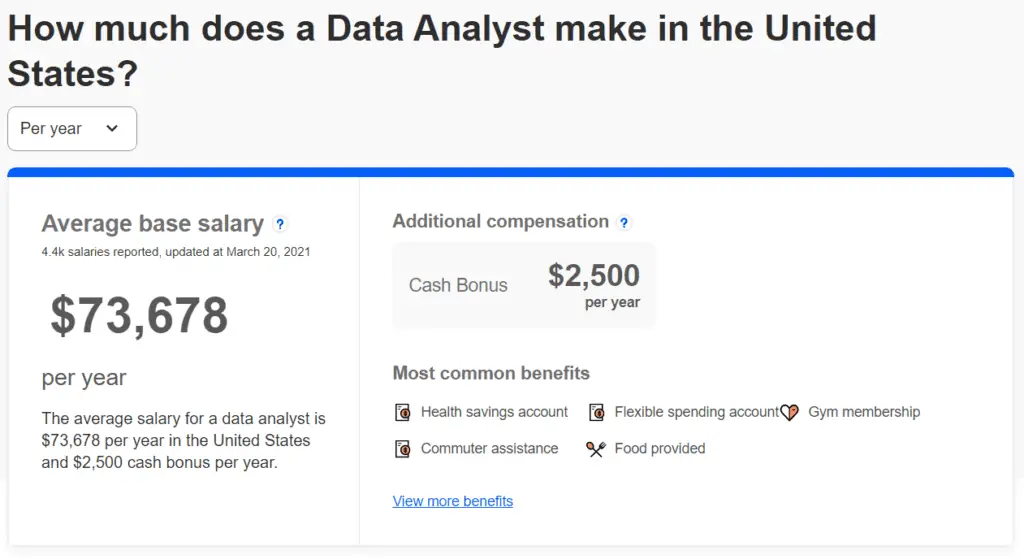
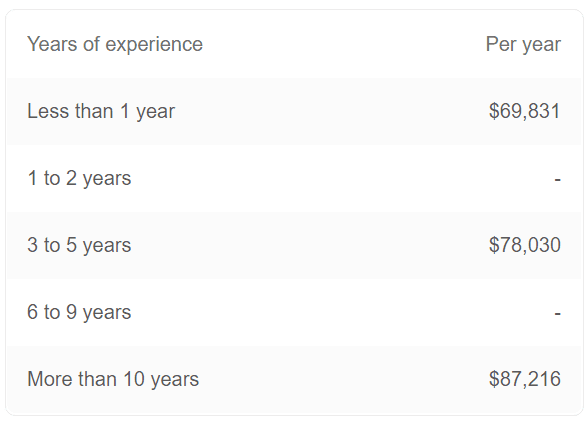
An entry-level data analyst position would bring in an annual average base salary of USD$69,831 if you have less than a year of experience. Therefore, do consider the different experience levels when finding your salary expectations.
BI Analyst:
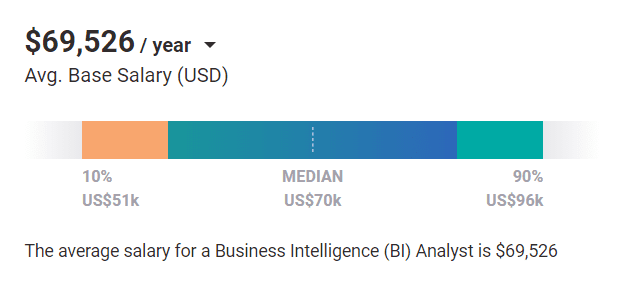
According to Payscale, the annual average base salary of a BI analyst is USD$69,526. Although this might seem slightly lower than the average data analyst salary, the BI analyst role is more ill-defined than that of the data analyst.
Therefore, the salary ranges given here should not be one that you should depend on for a full salary guide for your career salary expectations.
I would recommend checking out several other career sites for a clear comparison in your area!
Disclaimer
All my opinions given here are purely based on my experience and research about data analysts and business intelligence analysts and do not represent all data analysts and BI analysts out there.
Every job is created differently for different, specific purposes that do not always match up to the majority.
Therefore, do understand that what I’ve written here should only act as a quick guide to give you what most of the roles are generally like.
Final Thoughts
There’s much to learn between the the two roles, right? I’m sure you’ve learned a thing or two about the few specific areas where they are similar and where they differ.
If you’re currently looking out for jobs within the data analytics field and are confused between these roles, I hope that you’ve gained some clarity between the two of them! Thanks for reading!
What is the Difference Between Business Intelligence and Data Analytics?
The difference between business intelligence and data analytics is that business intelligence focuses on data warehousing and ETL and data analytics refers to the analysis and transformation of data. However, they are not mutually exclusive: business intelligence belongs under the broader field of data analytics.
Both of them belong under the larger field of data science as well.
What is a BI Data Analyst?
A BI data analyst focuses on driving business insight through the use of data analytics. The BI data analyst role typically handles data transformation, data warehousing, and optimizing business processes through relevant data. However, they are a midpoint between BI analysts and data analysts.
My Favorite Learning Resources:
My Recommended Learning Platforms!
| Learning Platform | What’s Good About the Platform? | |
|---|---|---|
| 1 | Coursera | Certificates are offered by popular learning institutes and companies like Google & IBM |
| 2 | DataCamp | Comes with an integrated coding platform, great for beginners! |
| 3 | Pluralsight | Strong focus on data skills, taught by industry experts |
| 4 | Stratascratch | Learn faster by doing real interview coding practices for data science |
| 5 | Udacity | High-quality, comprehensive courses |
My Recommended Online Courses + Books!
| Topic | Online Courses | Books | |
|---|---|---|---|
| 1 | Data Analytics | Google Data Analytics Professional Certificate | – |
| 2 | Data Science | IBM Data Science Professional Certificate | – |
| 3 | Excel | Excel Skills for Business Specialization | – |
| 4 | Python | Python for Everybody Specialization | Python for Data Analysis |
| 5 | SQL | Introduction to SQL | SQL: The Ultimate Beginners Guide: Learn SQL Today |
| 6 | Tableau | Data Visualization with Tableau | Practical Tableau |
| 7 | Power BI | Getting Started with Power BI Desktop | Beginning Microsoft Power BI |
| 8 | R Programming | Data Science: Foundations using R Specialization | Learning R |
| 9 | Data Visualization | – | Big Book of Dashboards |