
This post may contain paid links to my personal recommendations that help to support the site!
You’re likely already a user of Tableau or have at least heard about its usefulness before. But a common question comes up often – how is tableau used in healthcare?
Based on my research here’s what I found on Tableau in healthcare:
Tableau is used in healthcare for data analytics and business intelligence of operations. Data visualization in Tableau is used to present data and provide reporting on operations. However, Tableau is still not commonly used in healthcare organizations.
Tableau has so many features that can be leveraged for improving the healthcare field!
Do read on to check out our Top 7 real-life examples of Tableau applications in healthcare:
7 Uses of Tableau in Healthcare
- Maximizing Quality and Safety Performance
- Improving Operational Excellence
- Managing Emergency Medical Services
- Tracking Intensive Care Unit Patient Status
- Analyzing Patient Volume Trends
- Reducing Wait Time and Redundant Labor
- Monitoring Cost, Quality, and Utilization Patterns
- Reorganizing and Optimizing Physician Schedules
- Ensuring Supply Chain Demand
Now, let’s have a deeper look at how these examples have utilized Tableau to help within healthcare!.
1. Maximizing Quality and Safety Performance
Here’s the first use case I found – where Tableau was used to improve the quality and safety performance of a hospital!
In this example, Massachusetts General Hospital‘s Quality and Safety Operations Department leveraged the functions and automation provided by Tableau bringing about many improvements to the hospital safety standards.
Through the use of interactive dashboards, clinicians and healthcare workers were able to benchmark themselves against national quality and safety standards.
By measuring such numbers, the clinicians were more exposed to high-impact performance metrics!
Here are some of their achievements in using Tableau:
- An 85% reduction in Catheter-associated Urinary Tract Infections (CAUTI)
- Reduction in readmissions for high-risk patients from 17% to 14.5%
- Elimination of a large number of ad-hoc reporting
If you’re curious to learn more, here’s a video of their sharing during the Tableau Conference 2017:
Want to dive deeper into this example?
Check out the full Tableau Webinar for this use case over here.
Looking to learn Tableau through webinars?
Check out my article on Tableau webinars here.
2. Improving Operational Excellence
Here’s another great use for Tableau in healthcare!
In this example, we’ll be looking at how operations were improved in a clinic in 2017!
Cleveland Clinic, one of the largest hospital systems in the country, adopted Tableau as part of its healthcare analytics strategy.
They implemented dashboards across several projects, ranging from a call-back program to assess the wellbeing of patients, measuring imaging turnaround time, and monitoring clinical pathways, just to name a few!
Here are some of the impacts Tableau has made on their hospital:
- Increase in patient satisfaction
- Identification of outliers in imaging turnaround time
- Achieved 60% cost savings after managing the spine care clinical path
Learn more about the other applications they’ve had in this video below:
Want to know how much Tableau costs and if it’s worth it to get for yourself/your company?
Read all about it in my article here.
3. Managing Emergency Medical Services
Now here’s one that’s just too cool to not share with you!
Tableau has been in use by the city of Cincinnati to track emergency incidents and their responses!
When an incident requiring emergency medical services occurs, all the data is registered into a Computer-aided dispatch (CAD) and reported into a summarized dashboard!
Take a look at the screenshot of their dashboard below!
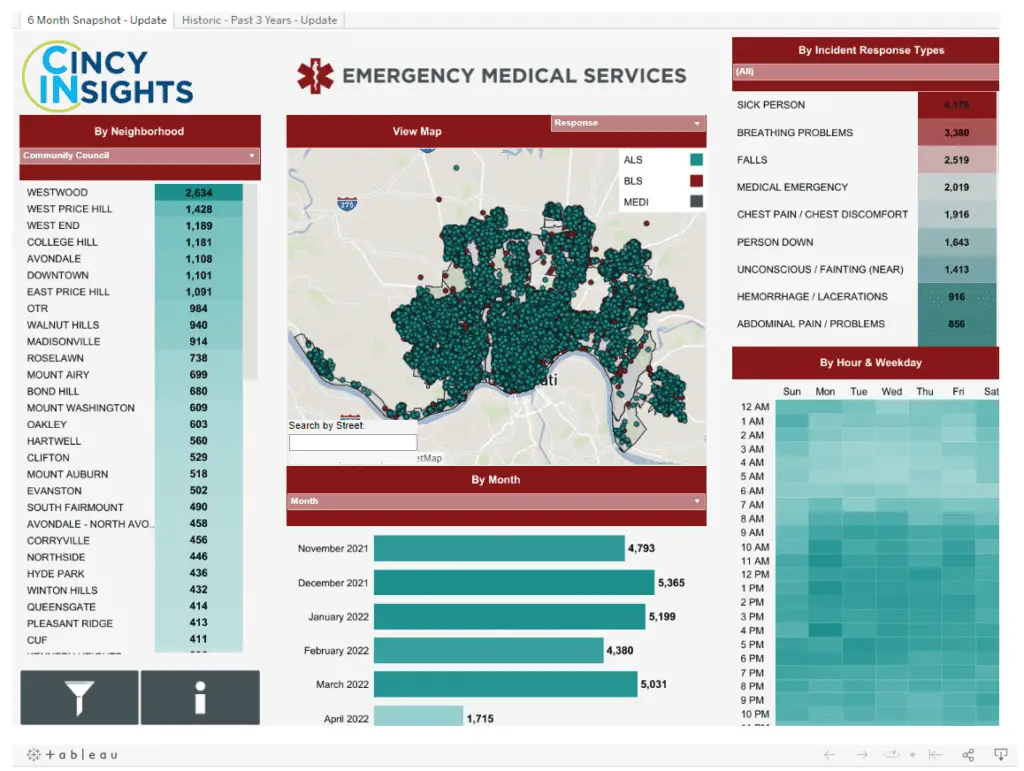
This dashboard is used to track and manage the responses to the city and analyze the common incident types!
From this dashboard, they are able to physically map out hotspots for certain emergency medical incidents and their related timings!
Want to explore the dashboard for yourself?
Have a look at their Emergency Medical Service dashboard here.
4. Tracking Intensive Care Unit Patient Status
Here’s another use case I found from Singapore, where I live!
Singapore General Hospital‘s Intensive Care Unit (ICU) is currently leveraging Tableau Server for the monitoring of patient status.
They created a dashboard for easy use by clinicians to access secure data on patients’ conditions. This has increased clinician visibility of the live status of patients in a clear manner.
What was previously done only through Excel, is not presented in a neat way. Imagine that!
“Everything is colour-coded, so in one easy glance, data that was previously presented in an Excel spreadsheet is now in an easily understandable format,”
Mr Steven Tan, Principal Analyst, Office of Insights and Analytics (OIA), Division of Digital Strategy (DDS) at SingHealth
During the pandemic, beds were a scarcity and had to be optimized. This implementation of the dashboard has helped manage bed capacity and allocate empty beds for new cases.
Read more over here.
Are you curious to find out how more from a community of Tableau users in healthcare? Well, I’d recommend looking at a Healthcare Tableau User Group.
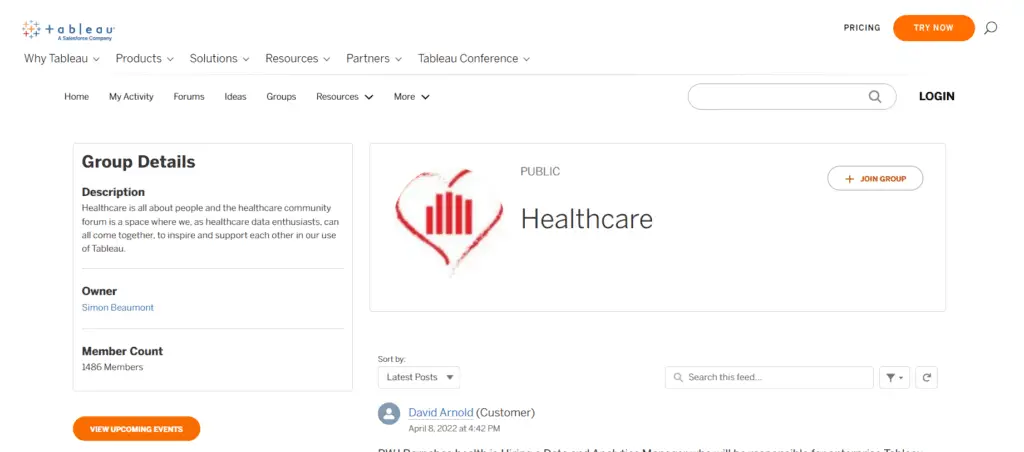
Here’s a recording of one of the Healthcare Tableau User Group meetups, do check it out!
5. Analyzing Patient Volume Trends
Tableau is also being used as a self-service platform to measure patient volume trends in healthcare!
Let’s explore more in this example below:
Sheikh Khalifa Medical City Ajman (SKMCA), a healthcare provider in the UAE has adopted Tableau as a robust analytics solution.
Through the use of the Tableau dashboards, the SKMCA had better access to data on patient volume, among other information.
Also, they created interactive dashboards for healthcare operations that were flexible, reducing the time it takes to generate ad-hoc reports!
This created a culture of self-service analytics, where the data is decentralized and accessible to the clinicians who need them the most!
Read more about their success with Tableau over here.
Want to learn more about Tableau?
Here’s an article all about Tableau for business.
Or you can also check out this post I made on who Tableau is designed for here.
6. Reducing Wait Time and Redundant Labor
Wait time in healthcare is a common problem, and I’m sure is a common complaint among many patients, including myself!
Here’s a great example of how a health system solved this problem using Tableau:
The University of Michigan Health System (UMHS) focused on reducing wait hours across inpatient hospitals, outpatient hospitals, and clinics!
The UMHS formed a dedicated analytics team, the Fast Analytics team, to help bridge this transition to Tableau, where static reports were assessed to be replaced with Tableau dashboards instead.
Here’s the biggest win from the UMHS team:
A reduction in waiting time from 4.5 hours to just 4.5 seconds!
This led to the UMHS Fast Analytics team clinching the Health Data Management‘s Project of the Year award. That’s really impressive, I must say!
Read all about it in this article here.
Want to know about a use case of Tableau in healthcare but in an informal setting?
Here’s an interview of a Tableau use case in healthcare that I think you’d like:
7. Monitoring Cost, Quality, and Utilization Patterns
Up next, let’s look at how Tableau has helped in monitoring patterns in healthcare data!
Community Health Center Network, a non-profit medical care organization for underserved communities in San Francisco, has used Tableau to identify patterns using dashboards.
Through the dashboards created, Community was able to monitor patients with higher risk scores, and patients who miss their visits and segment them.
Let me share some of their successes:
- 37% increase in patients from post-hospital admission
- 12% decrease in emergency department visits
- 14% decrease in readmission rates
Really amazing work!
Curious to read more? Check out this article here.
Want to know if it’s worth learning Tableau for yourself? Check out this article here.
8. Reorganizing and Optimizing Physician Schedules

Other than looking at patients, hospitals can also look to optimize physicians!
Take a look at this example I found below!
Piedmont Healthcare, a five-hospital system in North Georgia made really good use of Tableau in a unique way that has helped improve the overall inefficiencies in physical scheduling.
They had an analytics project called Patient First, where physicians’ schedules were analyzed and reorganized according to periods of higher demand.
And patients were also impacted!
Check out the quote from Mark Jackson from Piedmont below:
We’ve seen a 50-percent improvement in our variance from benchmark in cardiovascular length of stay. We’ve also seen a 10-percent reduction in heart failure readmissions, and we’ve seen a 12-percent reduction in readmissions for patients who are heart attack victims. And overall, that’s improved our patient satisfaction scores by 7 percent.
Mark Jackson, Business Intelligence Manager, Piedmont Healthcare
Read more about the impact of Tableau in Piedmont in the full interview article here!
9. Ensuring Supply Chain Demand

Beyond the frontline of healthcare, Tableau is seen helping some other healthcare organizations in managing the supply chain!
Seattle Children’s Hospital, a pediatrics hospital, has used Tableau in aiding with common problems in the supply chain – overstocked inventory and expired products.
The team had created a demand flow system but did not have any solution for reporting this. Through the implementation of Tableau dashboards, at-risk products were tracked easily!
“Our supervisors use a Tableau report that shows what was delivered that same day. They can easily go out and check bin locations to see if product was delivered correctly.”
Jason Klein, Supply Chain Specialist, Seattle Children’s Hospital
By allowing easier tracking, clinicians can focus on the things they’re great at – the clinical work. Tableau handles all the tracking and manual work!
“Our ability to manage our stock-keeping units (SKUs) has improved by 200% – from 2,000 before we adopted self-service analytics and visualization, to 6,000 currently. And most importantly, we save more than 40,000 clinical hours each year.”
Jason Klein, Supply Chain Specialist, Seattle Children’s Hospital
Want to read further?
Check out their full article here.
For more resources on Tableau in healthcare, you can check out the Achieving Operational Excellence in Healthcare webinar series by Tableau.
Related Questions
How is Data Visualization Used in Healthcare?
Data visualization is used in healthcare as a visual aid for clinical decision-making by clinicians. Clinicians use them to analyze trends, detect patterns and make data-driven clinical decisions. However, data visualizations use is not limited to clinical applications but also in operations and business analytics.
How is Analytics Used in Healthcare?
Analytics is used in healthcare for the optimization of resources. Analytics is used for the optimization of physicians, patient wait time, and medical supplies. However, analytics can be used in more applications such as, detecting patient risk, and detecting insurance claim denial reduction.
Want to know more about such applications?
Check out my article on 13 uses of data analytics in healthcare here.
How is Data Visualization Transforming the Healthcare industry?
Data visualization transforms healthcare by providing visibility of information to clinicians. Previously manual processes of reporting are being replaced with simple data visualization dashboards. Although well-received, the adoption of data visualization in healthcare is slow.
How are Graphs used in Healthcare?
Graphs are used in healthcare for monitoring patients and resources. Graphs are commonly used by clinicians to assess patient conditions and predict at-risk behavior in patients. However, graphs made through data visualization software can also be used for business and operations uses.
Final Thoughts
And there you have it, 9 really interesting examples of Tableau being used in healthcare! Many of them have created a huge impact in their local communities.
I hope you’ve learned something from this article! Thanks for reading!
My Favorite Learning Resources:
My Recommended Learning Platforms!
| Learning Platform | What’s Good About the Platform? | |
|---|---|---|
| 1 | Coursera | Certificates are offered by popular learning institutes and companies like Google & IBM |
| 2 | DataCamp | Comes with an integrated coding platform, great for beginners! |
| 3 | Pluralsight | Strong focus on data skills, taught by industry experts |
| 4 | Stratascratch | Learn faster by doing real interview coding practices for data science |
| 5 | Udacity | High-quality, comprehensive courses |
My Recommended Online Courses + Books!
| Topic | Online Courses | Books | |
|---|---|---|---|
| 1 | Data Analytics | Google Data Analytics Professional Certificate | – |
| 2 | Data Science | IBM Data Science Professional Certificate | – |
| 3 | Excel | Excel Skills for Business Specialization | – |
| 4 | Python | Python for Everybody Specialization | Python for Data Analysis |
| 5 | SQL | Introduction to SQL | SQL: The Ultimate Beginners Guide: Learn SQL Today |
| 6 | Tableau | Data Visualization with Tableau | Practical Tableau |
| 7 | Power BI | Getting Started with Power BI Desktop | Beginning Microsoft Power BI |
| 8 | R Programming | Data Science: Foundations using R Specialization | Learning R |
| 9 | Data Visualization | – | Big Book of Dashboards |
More Articles For You
- 5 Ways to Start Learning Data Science
- How I Would Learn Data Analytics in 2024
- How to Learn Data Analytics in 2024
- AWS Cloud Technology Consultant Professional Certificate: Review
- Microsoft Power BI Data Analyst Professional Certificate: Reviewed!
- Tableau Business Intelligence Analyst Professional Certificate: A Review