Introduction
Hey Anylearners! Tableau is an amazing data analytics tool, one that many business intelligence analysts must have in their data toolbox. Being a fairly versatile and widely-used analytics software among many large companies, Tableau offers a wide range of integrations with popular data sources. A common problem faced by new users is the different Tableau data sources and how to connect them properly. Don’t worry, that’s why I sourced some basic information in this tutorial for your learning. Enjoy!
Tutorial Outline
In this tutorial, I would be giving an introduction to Tableau data sources and how to connect them in Tableau desktop. Also, this guide will also cover some basic information on the different possible types of data sources as well as a short step-by-step guide on how to connect them.
Therefore, if you are new to Tableau, you may refer to my previous post on an introduction to Tableau here before proceeding with this post.Before we begin, I would assume that you already have Tableau Desktop installed in your computer, if you have not done so, please have it installed before reading.
So now you have Tableau Desktop installed, great! The next step in your amazing data visualization journey is to have Tableau Desktop connect to some of your data sources. This can be a simple process to those familiar with Business Intelligence (BI) software but a daunting one for new users. Therefore, I will be covering the following areas in detail:
- Types of Tableau Data Sources
- Live and Extract Data Sources
- Data Source Filters
- Connecting to a Data Source – Example
1. Types of Tableau Data Sources
As a popular BI option used in many organizations for analytics, one key advantage of Tableau is it’s access to a large selection of data connectors that link with popular databases. These data sources can be categorized into 4 common distinct types.
- File Systems
- Cloud-Based Systems
- Relational Database Systems
- Open Database Connectivity (ODBC)
1. File Systems
File systems are the most commonly-used data storage types used among professionals every day. You guessed it – these include the spreadsheets we use frequently. More specifically, some examples of File Systems include Excel files (.xlxs, .xsx) and comma-separated values (CSV) files. If you are a frequent Excel user, this is great news for you!
With the data coming from tables of neat rows and columns, the data connected would be easily recognized automatically in Tableau, allowing you to create more versatile charts easily. This would take your Excel charts onto the next level.
2. Cloud-based Systems
For the more advanced users, you’re not being left out! Tableau offers connections to numerous cloud-based systems as well. Cloud systems are sources which have their data stored up in a cloud, which can be accessed on-demand. Some of these include Azure, Amazon Web Services (AWS) and Google BigQuery. These options open up so many possibilities for companies that hold their data in large data architecture providers to visualize their data through Tableau.
3. Relational Database Systems
Relational database systems manage data that have relations between different tables. These are built with the relational model in design. For organizations that store data in relational systems, Tableau allows connections as well. These systems are also common among companies for storing data. Some of these include – Microsoft SQL Server, MySQL and Oracle.
4. Open Database Connectivity (ODBC)
Tableau also offers some connections that do not fit within the previously-mentioned categories. This is possible through an ODBC, which is a standard application programming interface (API). It allows connections to database management systems (DBMS). This means that developers are able to create custom “bridges” from their various respective sources.
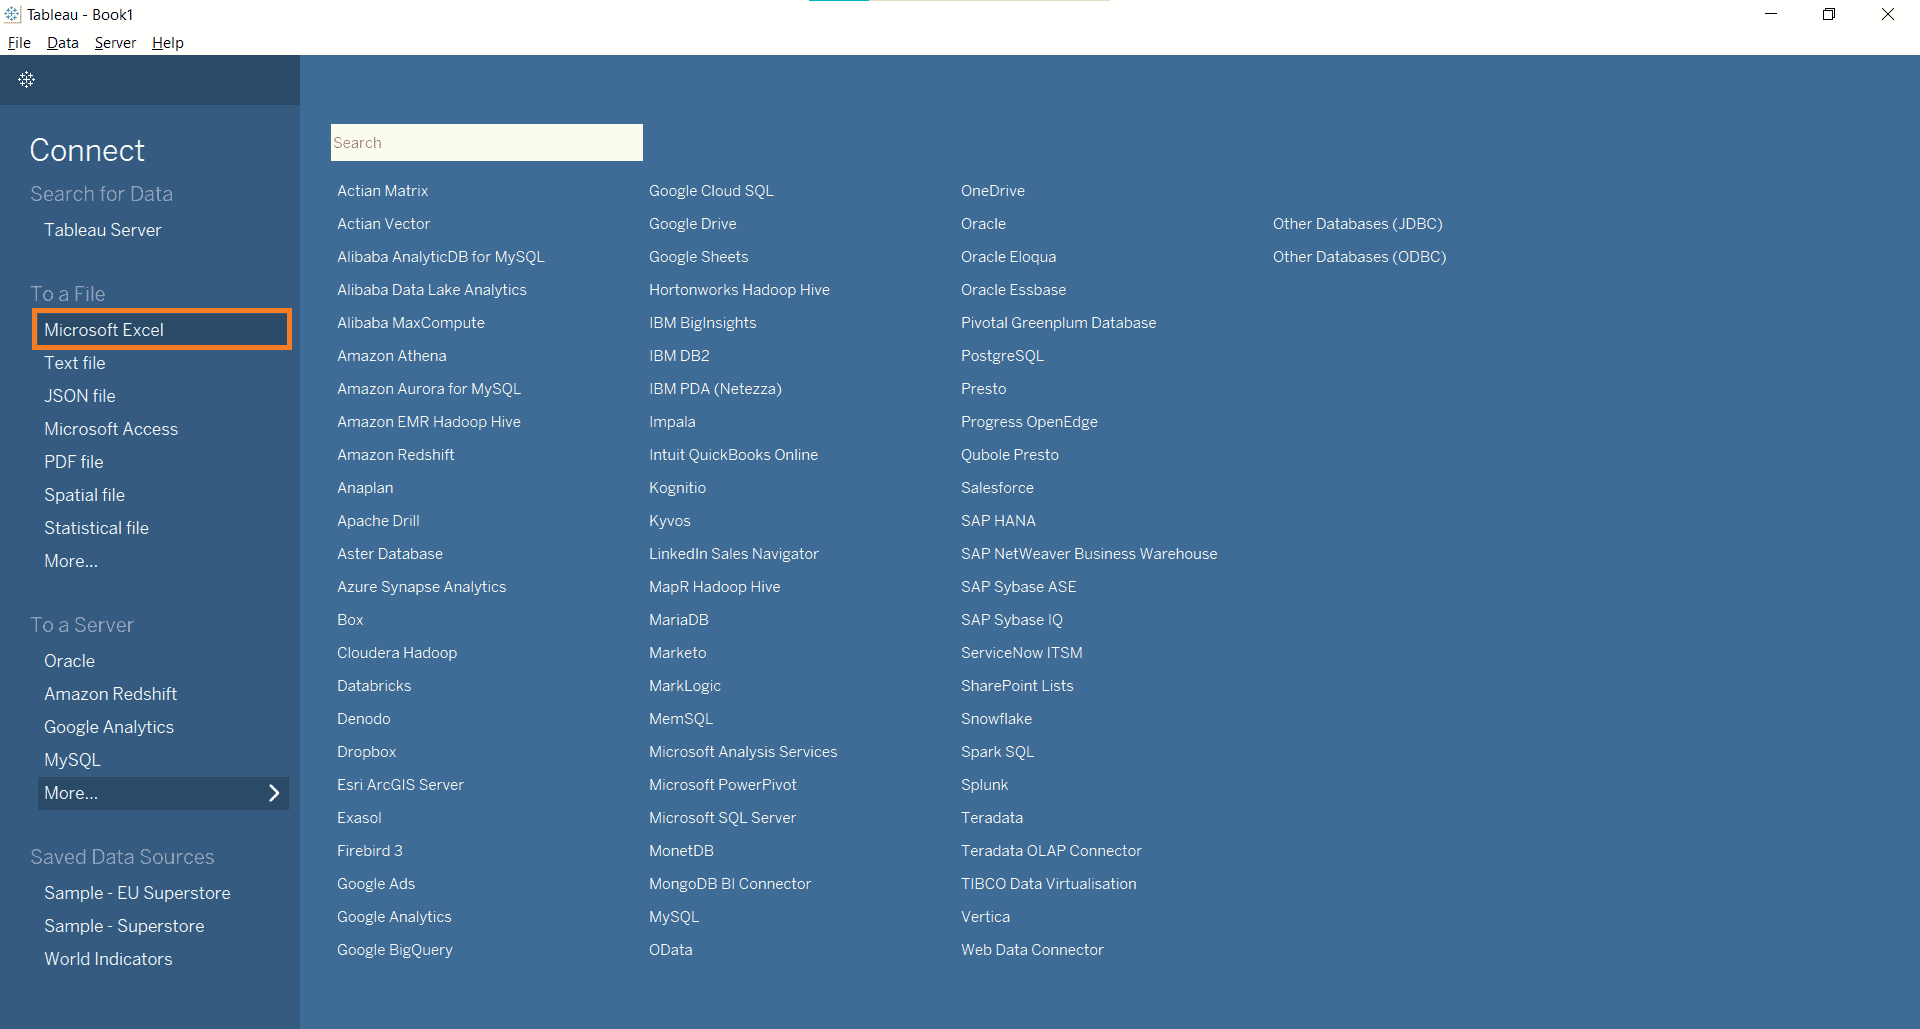
Here is a screenshot of the selection of data sources available on Tableau Desktop.
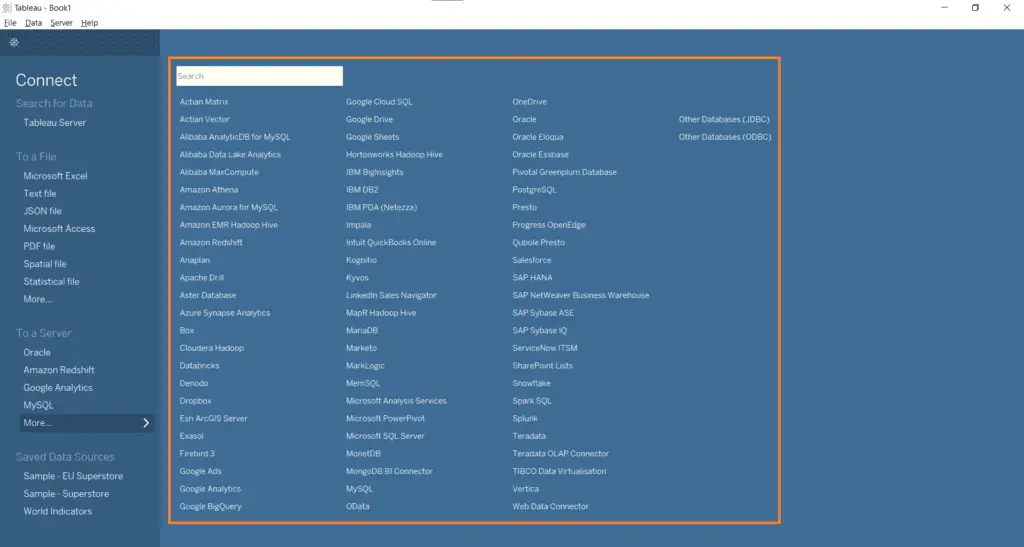
2. Live and Extract Data Sources
Upon connecting to any relational database or cloud database, the data that flows into Tableau may or may not be considered refreshed live. Tableau streams data from its data source through two main ways:
- Live Sources
- Data Extracts
Live Sources

Live sources show data as how they are in their original data sources – they are not offline. Any changes to the original source are updated, keeping data fresh as it is collected.
Data Extracts

Data extracts are offline extracts of the data sources that are not updated. These extracts usually come with a date and time stamp to show the time of extract. This is used when exporting a Tableau workbook for sharing offline. Extracts also do not require querying, which is great for quick access to the data.
Here’s an example of a data source below that requires extracts only, from Google Analytics.

3. Data Source Filters

Additionally, for every data source, filters can be applied onto datasets before they are built into charts and dashboards. This allows us to narrow data down to the exact data we need before working on them. This is a useful feature when building dashboards that handle a large amount of unnecessary data that may slow things down. Efficient use of filters can play a huge role in your analysis efficiency!
4. Connecting to a Data Source – Example
The following instructions are for connecting to an Excel file data source to Tableau Desktop.
Here is how you connect to a data source in Tableau:
Total Time: 10 minutes
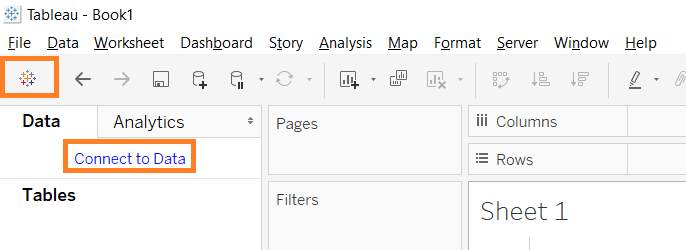
Click the Tableau logo button on the top-left hand corner
Select Microsoft Excel
This is found under the To a file section at the left-hand column.
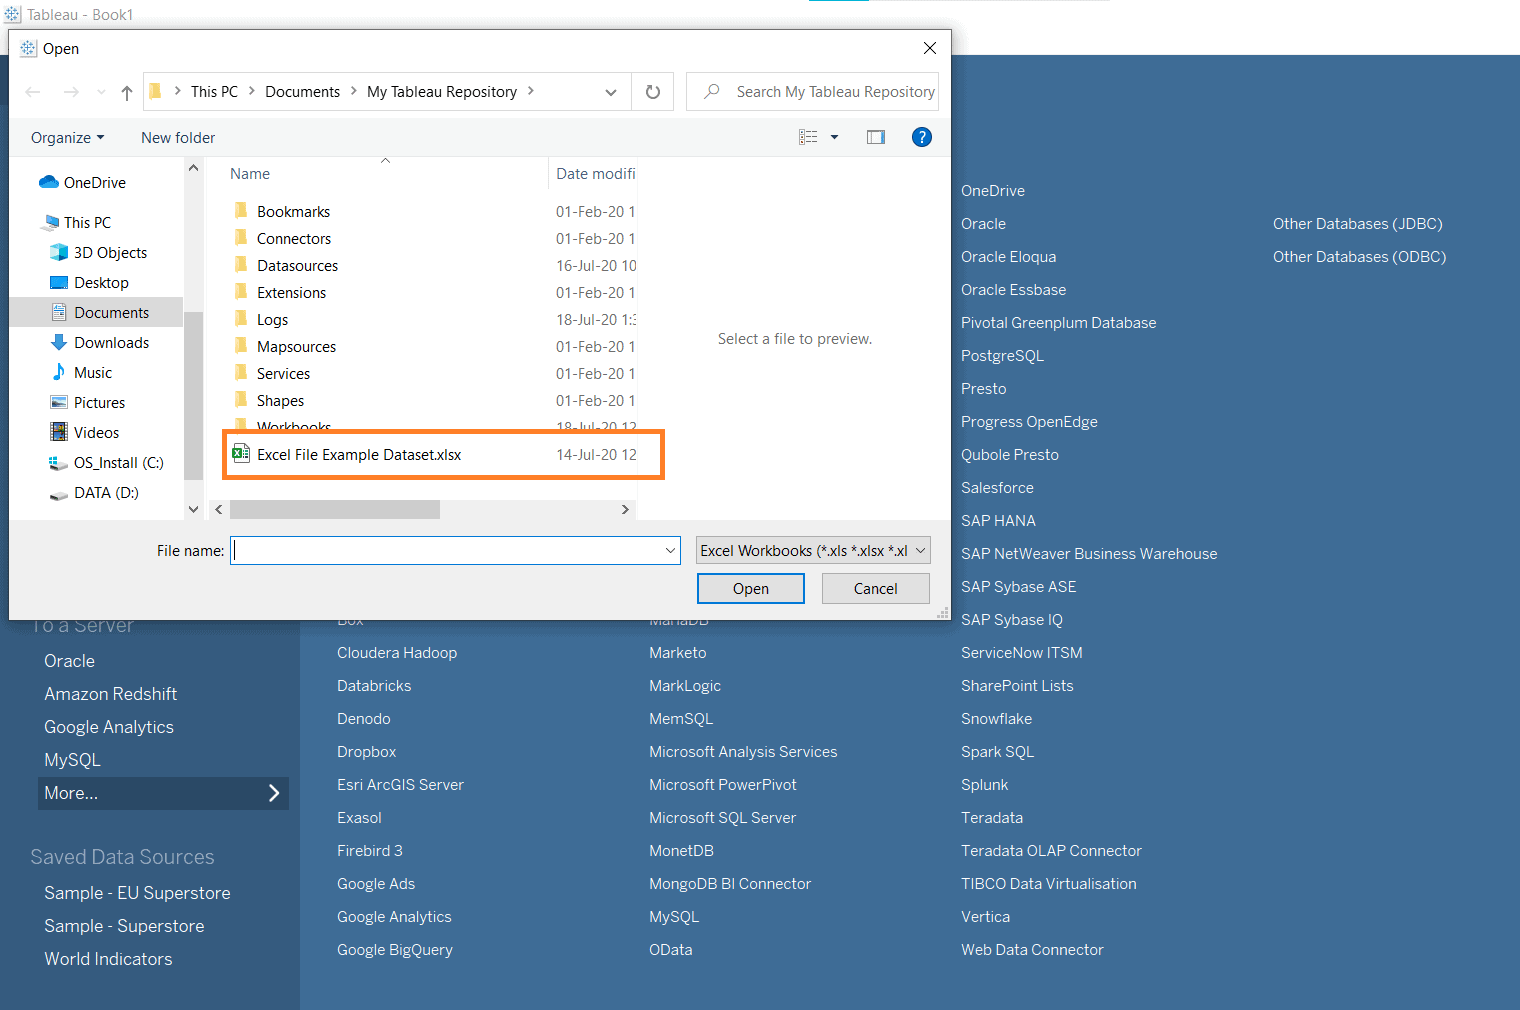
This should also bring up a file directory dialog box.
Navigate to your Excel file and select Open
In my case, I have placed my Excel file under My Tableau Repository for easy access. You do not need to place the file here, any file location should be fine.
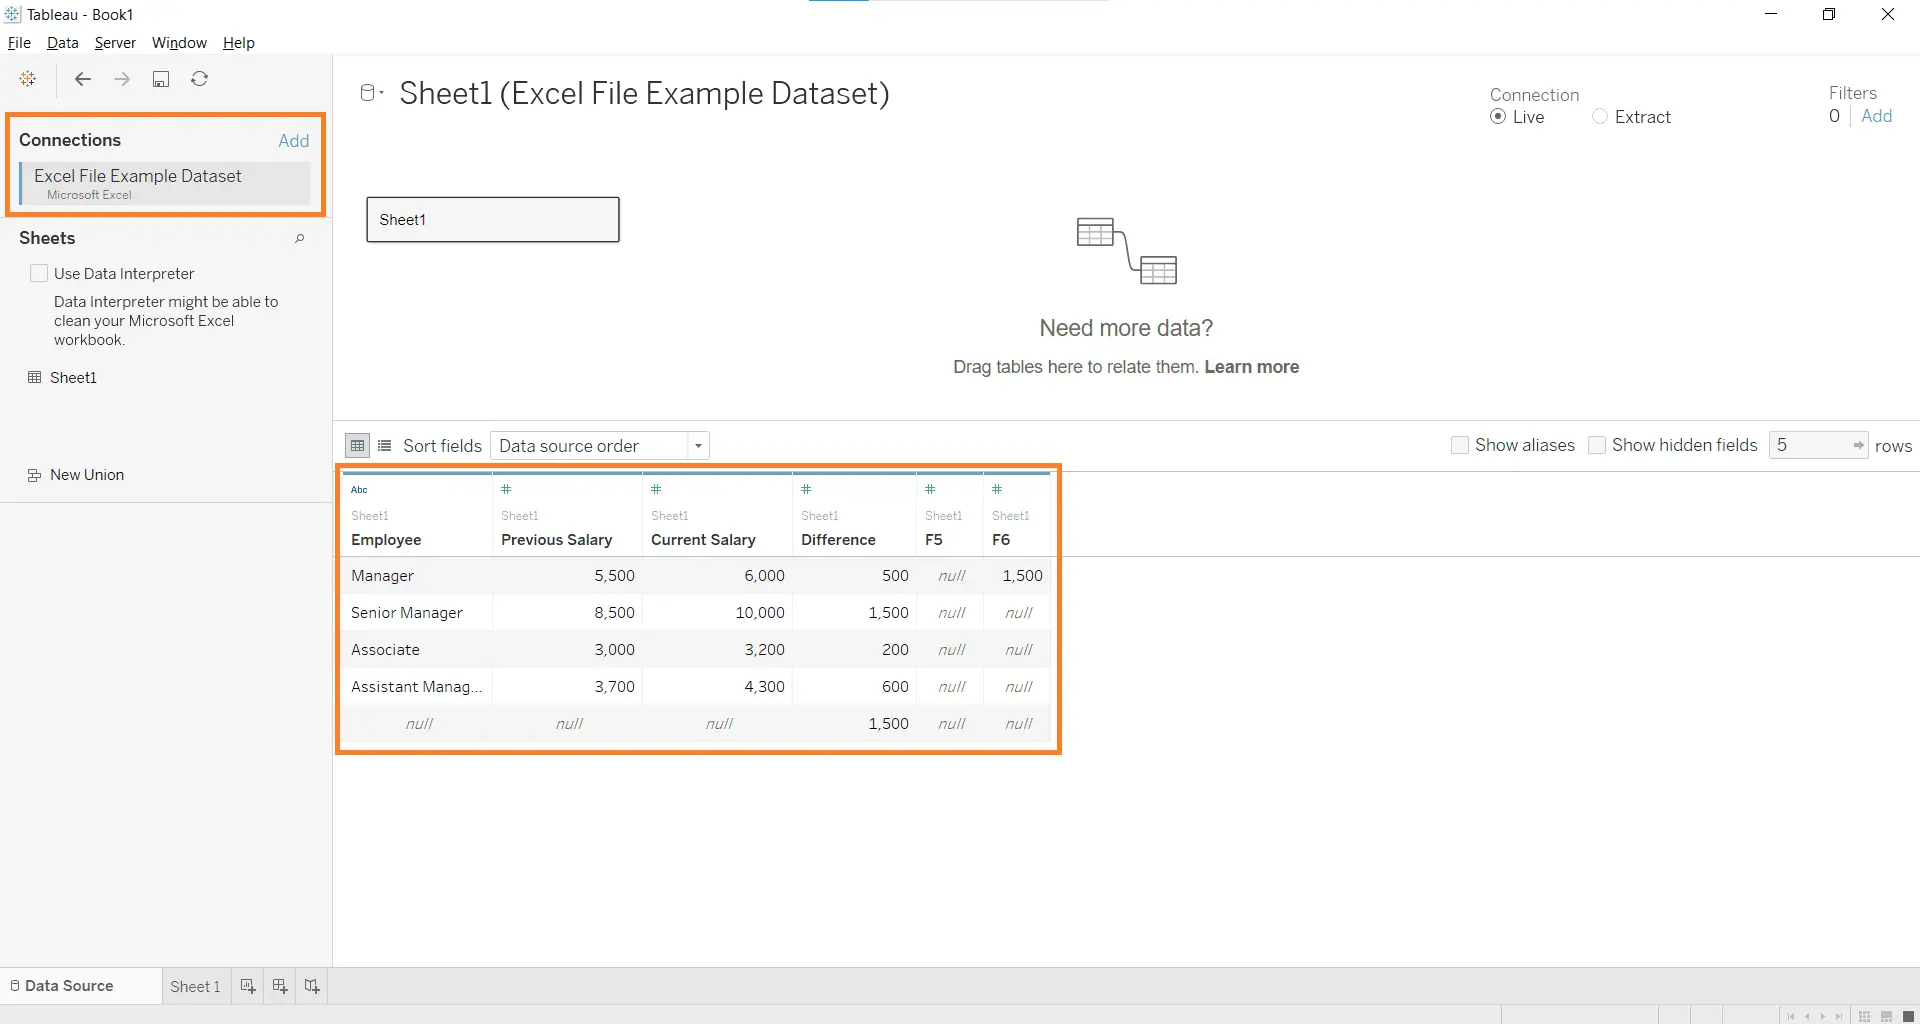
Your Excel file should be connected
Your data source is connected and is ready for some analysis work!
That wasn’t that tough, was it? I know the interface may seem foreign to some pure beginners, but I believe that with some playing around with the different features for connecting data, these steps would be completed within seconds. As you start to grasp the ropes of connecting file systems data sources, you may want to explore connecting from cloud sources as well. Being well-versed in this basic first step is key to completing a quick but clean analysis in Tableau.
Final Thoughts
Well done in making it this far in this post, I commend you for your perseverance in learning! With each step of learning comes some discomfort, especially with new technology like Tableau. I understand that having to develop a new skill might be daunting at first, but with proper knowledge and hard work, I’m sure grasping this skill of using Tableau would pay off.
Moreover, the demand for knowledge in Tableau has been rising over the past few years. Your first step in this journey should give you returns manifold once you master this shiny new tool.
Conclusion
In conclusion, Tableau offers a wide selection of data connectors of different source types. Learning how they differ and how to properly connect them is a crucial skill in any data analyst or Business Intelligence Analyst. I hope you have learnt something new about Tableau data sources and how to connect them today! Thanks for reading.
My Favorite Learning Resources:
My Recommended Learning Platforms!
| Learning Platform | What’s Good About the Platform? | |
|---|---|---|
| 1 | Coursera | Certificates are offered by popular learning institutes and companies like Google & IBM |
| 2 | DataCamp | Comes with an integrated coding platform, great for beginners! |
| 3 | Pluralsight | Strong focus on data skills, taught by industry experts |
| 4 | Stratascratch | Learn faster by doing real interview coding practices for data science |
| 5 | Udacity | High-quality, comprehensive courses |
My Recommended Online Courses + Books!
| Topic | Online Courses | Books | |
|---|---|---|---|
| 1 | Data Analytics | Google Data Analytics Professional Certificate | – |
| 2 | Data Science | IBM Data Science Professional Certificate | – |
| 3 | Excel | Excel Skills for Business Specialization | – |
| 4 | Python | Python for Everybody Specialization | Python for Data Analysis |
| 5 | SQL | Introduction to SQL | SQL: The Ultimate Beginners Guide: Learn SQL Today |
| 6 | Tableau | Data Visualization with Tableau | Practical Tableau |
| 7 | Power BI | Getting Started with Power BI Desktop | Beginning Microsoft Power BI |
| 8 | R Programming | Data Science: Foundations using R Specialization | Learning R |
| 9 | Data Visualization | – | Big Book of Dashboards |

