
This post may contain paid links to my personal recommendations that help to support the site!
Tableau has many functions to offer in data analytics but if you’re just starting out in learning the ropes of Tableau, you might be overwhelmed with the huge amount of resources available out there. These webinars are usually presented by experts so they’re perfect for beginners to follow along.
If these comprehensive webinars sound like your way of learning, then allow me to list out some of my personal favorites among the huge amount of webinars out there.
8 Tableau Webinars to Start Your Learning in Tableau
- Starting Tableau Right (37min)
- Introduction to Prep Builder (50min)
- Introduction to Tableau – Provider (59min)
- Start your Tableau Online Journey (31min)
- 5 Charts Every Sales Leader Should be Looking At (27min)
- Introduction to Tableau Desktop: Part 1 – Bank Loans (57min)
- Data Storytelling Best Practices (41min)
- What is a dashboard, anyway? (1hr)
Tableau Account Set-up (Before You Start Watching)
Before we start getting our hands on these webinar resources, you’d need a to sign-up for a FREE Tableau account on the Tableau website. Not to worry, this account is free to create and keep and I’ve been enjoying the resources from it since.
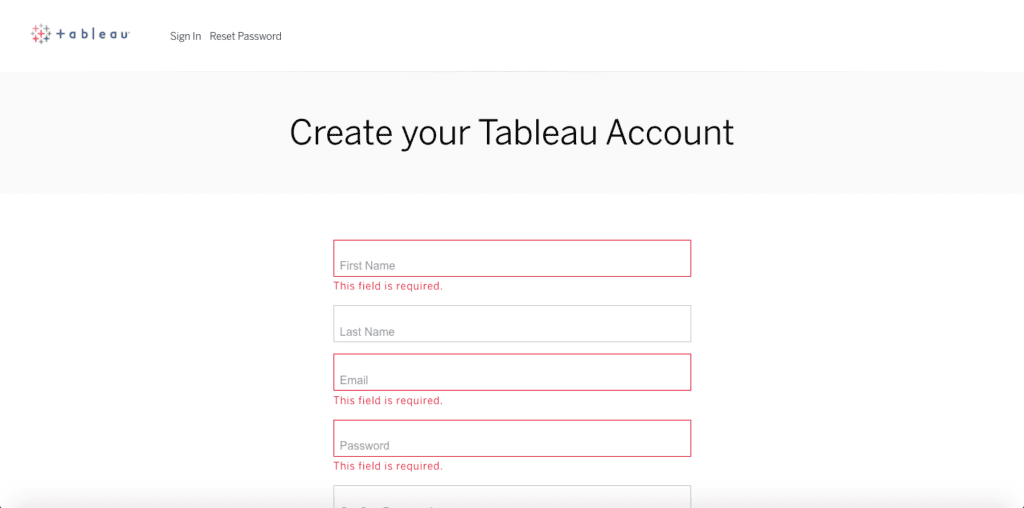
Head on over to this Registration Page to ensure that you get yourself all set-up and ready to access these webinar resources.
The Tableau website offers a massive amount of on-demand webinars accessible within its website. Each webinar allows an MP4 download, which can be really useful if you’re looking to watch these long webinars during your daily commute to work/school.
Tableau Webinars are just one of the clever ways to learn Tableau, among 6 other ways. Read more about the others over here.
1. Starting Tableau Right
If you’re someone that’s just starting out in Tableau and would like to explore about what they have to offer, then this webinar will be perfect for you. The Starting Tableau Right webinar is one that I found useful when onboarding and discovering the different options available when starting out Tableau.
Speaker(s): Jolene Yap, Renewals Manager (Southeast Asia), Sukriti Sekhri, Renewals Manager (India)
Video Length: 37:30 minutes
Main Points:
- Introduction to the Tableau Team
- User Customer Portal walkthrough
- Tutorial on how to control your product activation keys within your organization
- Further learning resources available for Tableau users
My Thoughts:
Here’s my honest opinion: this webinar is a great starting point for many organizations who are just starting out and implementing Tableau as their Business Intelligence or analytics tool within their company. Now, one thing I’d have to note is that this might not be the best webinar for those who are looking to learn more of the technical areas within Tableau Desktop.
Therefore, I would recommend this webinar mostly for business owners or key leaders of business intelligence and analytics within a company and not for analysts. However, having the extra knowledge of understanding how the system can be implemented might be useful for analysts if they are also planning to learning beyond just the technical knowledge of data visualization and dashboarding.
Summary:
As the title of this webinar suggests, this presentation, by two Renewals Managers from Tableau Software, highlights and addresses the most common questions and problems you would encounter when you’re just starting out in your Tableau journey. Some of the areas covered include the key team members you would be interacting from Tableau software, the User Customer Portal, handling activation keys within your organization and learning resources provided for using their products. Within a short half-hour presentation, this webinar summarizes the key aspects of implementing Tableau in an organization.
Link to Webinar: https://www.tableau.com/learn/webinars/starting-tableau-right-apac
2. Introduction to Prep Builder
To fully make use of all the products that a Tableau License has to offer, you might want to consider learning how to use Tableau Prep Builder to prepare data before producing data visualizations in Tableau Desktop. If you’re someone that’s looking for a great step-by-step guide through the basics of Tableau Prep Builder, then this webinar might be for you. The Introduction to Tableau Prep Builder Webinar is a good start for beginners who are looking for a complete, basic walkthrough of the functions within Tableau Prep Builder.
Speaker(s): Jessica Lella, Solution Engineer, Tableau
Video Length: 50:08 minutes
Main Points:
- Connecting and cleaning datasets
- Unions and Joins
- Connecting to outputs
- Scheduling and publishing workflows
My Thoughts:
Tableau’s Prep Builder is a crucial piece of software that many data analysts actually find themselves using for data preparation before loading the data into Tableau Desktop. This webinar gave me a really comprehensive overview of the basic functions within Tableau Prep Builder. I’m pretty new to the analytics space within Tableau but I’m quite sure that I learnt quite a lot from just this webinar alone.
If you’re like me, a heavy user of Tableau Desktop and it’s related products, I would recommend heading over to this webinar to run you through quickly the features to get you started. As someone who enjoys learning by getting my hands busy, I enjoy learning by doing and it helps that this webinar was presented through a walkthrough workshop style. I was able to follow along with the instructions in a step-by-step way. If you prefer a practical workshop like me, then this webinar is all for you!
Summary:
The Introduction to Prep Builder webinar introduces the several aspects and functions available in Tableau Prep Builder in a step-by-step workshop. Perfect for beginners, this webinar will guide you through the interface of Prep Builder, connecting to datasets, joins, outputs and workflows.
Link to Webinar: https://www.tableau.com/learn/webinars/introduction-prep-builder
3. Introduction to Tableau – Provider
Here’s a webinar that most of us would find helpful at the beginning stages of working with data visualizations within Tableau Desktop. Another webinar conducted by Jessica from Tableau, this is a neat workshop that’s perfect for absolute beginners looking for a walkthrough all of the whole workflow within Tableau.
Speaker(s): Jessica Lella, Solution Engineer, Tableau
Video Length: 59:59 minutes
Main Points:
- Connecting data to Tableau Desktop
- Building charts on sheets
- Crafting a dashboard in Tableau Desktop
- Publishing a dashboard to Tableau Server
My Thoughts:
If you’re looking for a solid resource to kick-start your Tableau learning journey, then go ahead and watch this webinar. Most of us starting this journey would want to get used to working with the Tableau Desktop software so this webinar would be a great way to start. This workshop guided me through all the basic features within Tableau Desktop; from connecting to a data source to creating charts that go into a dashboard to finally publishing them onto Tableau Server. I enjoyed following along the entire workflow through a hands-on session on my computer and it should be pretty easy to follow along if you’re a beginner as well.
Summary:
The “Introduction to Tableau – Provider” webinar is great summary of a typical workflow in Tableau Desktop, presented in a hands-on workshop format. If you’re looking to get your hands dirty and experience working in Tableau Desktop through an end-to-end workflow, this webinar is just for you. In this webinar you’ll learn the basics of data visualizations and publishing dashboards on Tableau Server.
Link to Webinar: https://www.tableau.com/learn/webinars/introduction-to-desktop-healthcare-provider
4. Start your Tableau Online Journey
An introductory overview of Tableau Online and its various features, this webinar is a great way for an analyst like you to discover more about the features of the cloud platform and how it can be implemented within your organization. Conducted and presented by Christophe from Tableau, the webinar is done in a hands-on format, where you’ll get to see and craft dashboards alongside the webinar.
Speaker(s): Christophe Ortegat, Solution Engineer, Tableau
Video Length: 31:46
Main Points:
- Overview of Tableau as an analytics platform
- Benefits of Tableau Online
- Building Dashboards on Tableau Online
- Organizing content on Tableau Online
My Thoughts:
This webinar gave me a good introduction to the possibility of Tableau Online being used as a platform for sharing my data visualizations within my organization. I got to learn how to set-up my account properly on Tableau online, building charts and dashboards on the cloud all within Tableau Online. Christophe also gave some great pointers when working within Tableau Online, especially when managing users and content for better sharing with the various data end-users.
Summary:
The “Start your Tableau Online Journey” webinar is perfect for those considering the option of having a cloud platform like Tableau Online in their organization. This comprehensive webinar covers both the the benefits as well as an actual demonstration of the entire dashboard creation process within Tableau Online. If you’re an analyst that has only been working on the offline Desktop app and beginning to explore the features of Tableau Online, this might just be the best way to start learning the features offered by Tableau Online!
Link to Webinar: https://www.tableau.com/learn/webinars/start-tableau-online-journey-anz
5. 5 Charts Every Sales Leader Should be Looking At
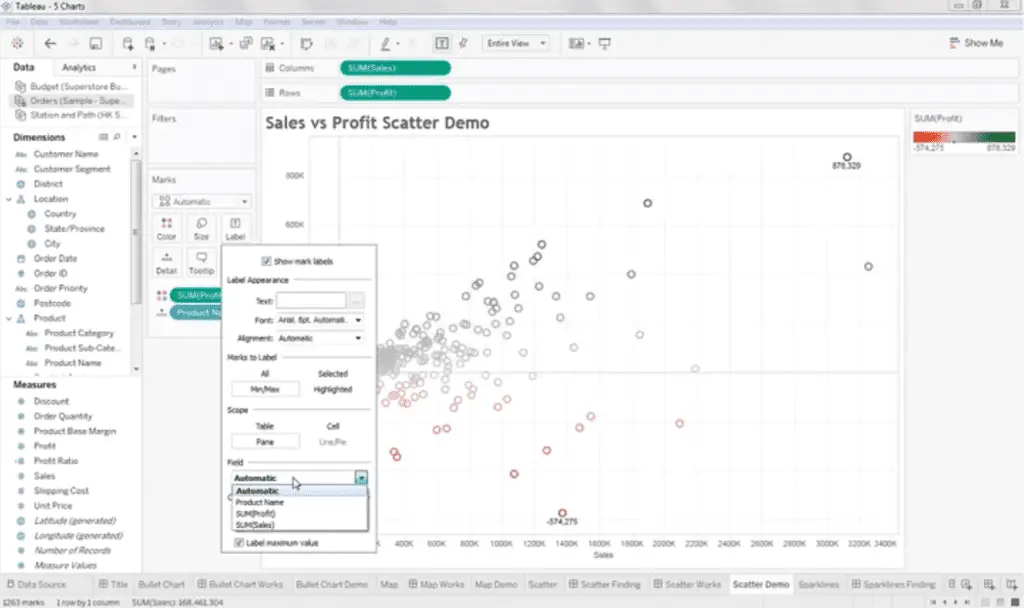
If you’re working in the sales department or if you’re looking to go into sales to support their data projects, then you’re most likely going to need to have some way to present all that information. This webinar is just for those who are looking to learn about the various ways sales data should be presented in a clear manner. With Bobby Wu a Sales professional from Tableau themselves, this webinar would give you a comprehensive overview of 5 easy charts to put into that sales dashboard of yours.
Speaker(s): Bobby Wu, Sales Consultant, Tableau
Video Length: 27:36 minutes
Main Points:
- Charts to visualize sales data such as:
- Bullet graphs
- Maps
- Scatterplots
- Sparklines
- Dealing with Seasonality trends
- Dealing with Regional Patterns
- Dealing with Acquisition Costs
My Thoughts:
I would say that I enjoyed learning the various charts taught in this instructional webinar by Bobby. The demonstrations were clear and well-explained. I was pleased to know that this webinar was more than just a simple PowerPoint presentation deck of charts. In fact, this webinar had a thorough and good amount of instructional demonstrations that were easy to follow along, even for those who are relatively new to Tableau Desktop. If you’re looking to learn some new charts for your sales dashboard, I’d recommend you give it a try!
Summary:
The webinar gives a great introduction to charts within Tableau Desktop, just for sales leaders. With the focus of the webinar on demonstrating charts that monitor and measure sales progress, the content is perfect for those who are really looking to get the best visualizations for sales. However, this webinar might only be focused on sales data so those who are not currently dealing with sales information, you might consider trying our next webinar below!
Link to Webinar: https://www.tableau.com/learn/webinars/5-charts-every-sales-leader-should-be-looking
6. Introduction to Tableau Desktop: Part 1 – Bank Loans
This webinar is the first part of a two-part series on working with Bank Loans data on Tableau Desktop. The webinar is covered by Jeff Black, who has a background in financial services and banking, so most of the webinar would be focused on visualizing financial loan data.
Speaker(s): Jeff Black, Financial Services Solution Engineer, Tableau
Video Length: 57:13 minutes
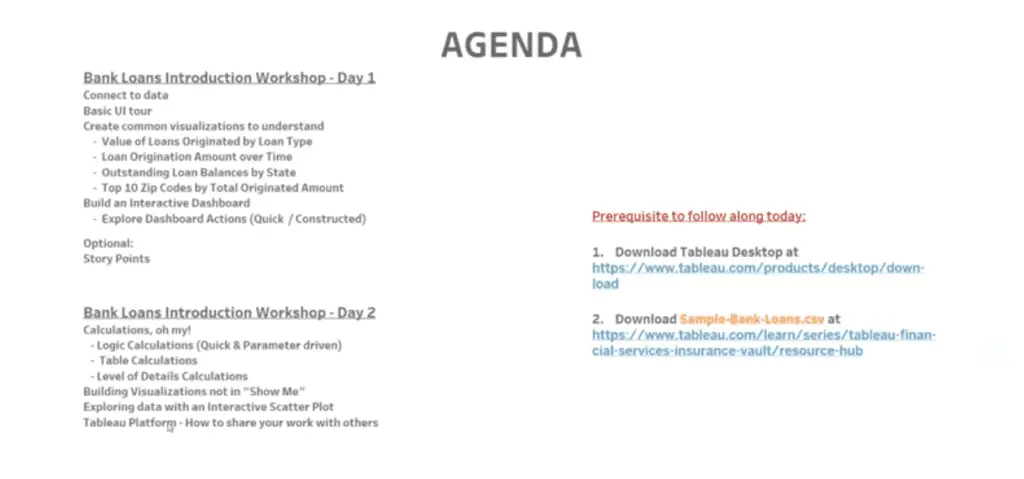
Main Points:
- Common visualizations for Bank Loan information
- Crafting an interactive dashboard
- Word cloud (not found in Show Me)
My Thoughts:
I found this webinar presentation relatively useful because of the charts that were covered, which were commonly used across different applications. Although I’ve never worked on an Bank Loan or financial data previously, I’d say that the content covered can still be a good resource for you if you’re looking to learn more about creating charts in Tableau Desktop in general. I especially enjoyed the last part of the session, where Jeff shared more about how to create a word cloud visualization not available through the “Show Me” function.
Summary:
This webinar is great for you if you are involved in the work of financial data analysis. It also would provide you with a great overview of the basic charts in Tableau, including a word cloud. An instructional step-by-step walkthrough, this webinar would benefit you if you prefer a hands-on approach to learning about Tableau Desktop using a sample bank loan dataset.
Link to Webinar: https://www.tableau.com/learn/webinars/introduction-desktop-bank-loans-pt1
7. Data Storytelling Best Practices
Most of the time, being a data analyst does not only involve the data processing and charting, you would also need to be a great data storyteller! Here’s webinar to get you started on some of the best practices on how you can get better at sharing your charts.
Speaker(s): Francis Dejonckheere, Customer Success Manager, Linsey Carlson, Customer Success Manager
Video Length: 41:35 minutes
Main Points:
- History of data storytelling: Why storytelling?
- Which analysis type? Explainatory or Exploratory?
- Design your exploratory analysis using the narrative arc
- Select the right Viz type
- Remove clutter
- Guide your audience with proper titles
- Emphasize important points
- Use white space
- Proper mood and tone
- Types of Data Stories
- Chart Demonstration
My Thoughts:
Now this is what I wish I had watched when I first started out learning Tableau and creating my own dashboards. The amount of value I got out of this webinar was clearly no small amount. As shown in the main points above, Francis and Lindsey did give a really impactful presentation on why data storytelling is so important. As a data analyst myself, I couldn’t agree more, except that I had no idea how lost I was. This webinar gave a really clear and comprehensive introduction to better data storytelling, which I really needed. Also, the bonus demonstration at the end helped me consolidate my learning better.
Summary:
An introduction presentation on data storytelling, this webinar was conducted for The Vault community to encourage better data practices and storytelling. The Data Storytelling Best Practices is perfect for anyone who is just starting out in Tableau and in need of some guide to help them craft their first few dashboards.
Link to Webinar: https://www.tableau.com/learn/webinars/data-storytelling-best-practices
8. What is a dashboard, anyway?
This presentation is for all you dashboard enthusiasts out there who seek after the best dashboard designs. Presented by Andy Cotgreave, Author of the Big Book of Dashboards, this webinar will give you a quick hour-long overview of how to evaluate dashboards and why you should craft a dashboard that matters to the end-users.
Speaker(s): Andy Cotgreave, Technical Evangelism Director, Tableau
Video Length: 1:00:23 hrs
Main Points:
- What is a dashboard?
- Examples of dashboards
My Thoughts:
Andy is just so passionate and enthusiastic when it comes to dashboards and when I found out that this webinar was presented by him, I knew that I had to include it in this list of must-watch webinars. I’ve personally read his book, the Big Book of Dashboards, and I thoroughly enjoyed it. This webinar is no different, as Andy goes through what a dashboard should be like – persuasive, informative, and inspiring. If you enjoy his webinar, you can also further your learning and check out his book from Amazon through this link here. I’ve even written a book summary and review of it here.
Summary:
This webinar is a great inspirational video for those looking to start out their careers as data analysts because of the basic ideas that were presented. Creating a persuasive dashboard is not easy because many analysts do not realize that it is very much an art. This webinar creates a foundation and direction by which many of you can follow if you’re seeking to improve yourself in data visualization of dashboards in Tableau.
Link to Webinar: https://www.tableau.com/learn/webinars/what-dashboard-anyway
Bonus: Tableau Tuesdays

Alright here’s some bonus good stuff for all of you who have read up to this point. Check out Tableau Tuesdays – monthly webinar topics presented by experts within Tableau. Whether you’re just a beginner starting your Tableau learning journey or if you’re an experienced analytics consultant, this webinar series will definitely benefit you as an analyst.
Link to the Webinar Series: https://www.tableau.com/learn/series/2021-tableau-tuesdays
In need of other clever ways to get started learning Tableau? Check out my beginner list of 7 ways to learn Tableau over here.
Conclusion
That’s all I have for now – a full list of on-demand Tableau webinars to kick-start your learning in Analytics! These webinars have been narrowed down based on my experience from going through the many (400+) webinars available on the Tableau website. I must say that these would be the BEST for those looking to start their analytics career, so do consider giving them a try. Thanks for reading!
My Favorite Learning Resources:
My Recommended Learning Platforms!
| Learning Platform | What’s Good About the Platform? | |
|---|---|---|
| 1 | Coursera | Certificates are offered by popular learning institutes and companies like Google & IBM |
| 2 | DataCamp | Comes with an integrated coding platform, great for beginners! |
| 3 | Pluralsight | Strong focus on data skills, taught by industry experts |
| 4 | Stratascratch | Learn faster by doing real interview coding practices for data science |
| 5 | Udacity | High-quality, comprehensive courses |
My Recommended Online Courses + Books!
| Topic | Online Courses | Books | |
|---|---|---|---|
| 1 | Data Analytics | Google Data Analytics Professional Certificate | – |
| 2 | Data Science | IBM Data Science Professional Certificate | – |
| 3 | Excel | Excel Skills for Business Specialization | – |
| 4 | Python | Python for Everybody Specialization | Python for Data Analysis |
| 5 | SQL | Introduction to SQL | SQL: The Ultimate Beginners Guide: Learn SQL Today |
| 6 | Tableau | Data Visualization with Tableau | Practical Tableau |
| 7 | Power BI | Getting Started with Power BI Desktop | Beginning Microsoft Power BI |
| 8 | R Programming | Data Science: Foundations using R Specialization | Learning R |
| 9 | Data Visualization | – | Big Book of Dashboards |
More Articles For You
- 5 Ways to Start Learning Data Science
- How I Would Learn Data Analytics in 2024
- How to Learn Data Analytics in 2024
- AWS Cloud Technology Consultant Professional Certificate: Review
- Microsoft Power BI Data Analyst Professional Certificate: Reviewed!
- Tableau Business Intelligence Analyst Professional Certificate: A Review